Government Regulatory Prosecutions for 2020
Number Year-to-date 450 Percent Change from previous year -23.6 Percent Change from 5 years ago -68.5 Percent Change from 10 years ago -74.1 Percent Change from 20 years ago -74.2
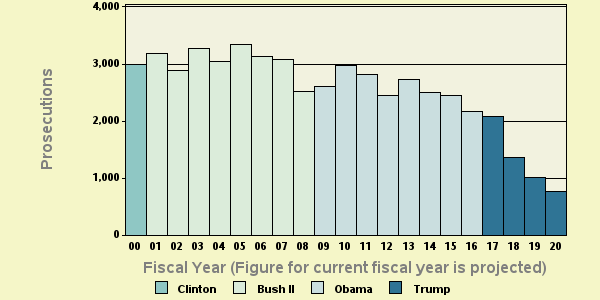
Table 1: Criminal Government Regulatory ProsecutionsThe latest available data from the Justice Department show that during the first seven months of FY 2020 the government reported 450 new government regulatory prosecutions. If this activity continues at the same pace, the annual total of prosecutions will be 771 for this fiscal year. According to the case-by-case information analyzed by the Transactional Records Access Clearinghouse (TRAC), this estimate is down 23.6% over the past fiscal year when the number of prosecutions totaled 1,009.
The comparisons of the number of defendants charged with government regulator offenses are based on case-by-case information obtained by TRAC under the Freedom of Information Act from the Executive Office for United States Attorneys (see Table 1).
Compared to five years ago when there were 2,444, the estimate of FY 2020 prosecutions of this type is down 68.5 percent. Prosecutions over the past year are much lower than they were ten years ago. Overall, the data show that prosecutions of this type are down 74.1 percent from the level of 2,974 reported in 2010 and down 74.2 percent from the level of 2,983 reported in 2000.
The long term trend in government regulatory prosecutions for these matters going back to FY 2000 is shown more clearly in Figure 1. The vertical bars in Figure 1 represent the number of government regulatory prosecutions of this type recorded each fiscal year. Projected figures for the current fiscal year are shown. Each presidential administration is distinguished by the color of the bars. To view trends month-by-month rather than year-by-year, see TRAC's monthly report series for the latest data.
Leading Program Categories
Within the broad category of government regulatory, cases were classified by prosecutors into more specific types.
Case types within government regulatory are
Contraband Cigarettes-Trafficking in
Copyright Violations
Counterfeiting and Forgery
Customs-Currency Violations
Customs-Duty Violations
Export Enforcement General
Fraud-Energy Pricing
Health and Safety Violations-Employees
Health and Safety Violations-Gen. Public
Money Laundering-Drug
Money Laundering-Other
Nuclear Waste Violations
Other-Regulatory Offenses
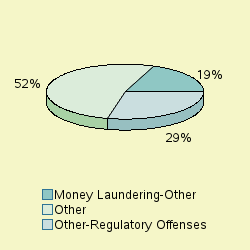
The single largest number of prosecutions of these matters through April 2020 was for "Other-Regulatory Offenses", accounting for 28.7 percent of prosecutions.
As shown in Figure 2, the second largest number of matters were prosecutions filed under the program area of "Money Laundering-Other " (19.1%) . The "Other" category in Figure 2 is comprised of a diverse group of programs. The largest specific programs within the "Other" category were: Counterfeiting and Forgery" (17.8%), "Money Laundering-Drug" (16.7%), "Customs-Currency Violations" (7.8%), "Export Enforcement General" (7.1%). See Figure 2.
Leading Investigative Agencies
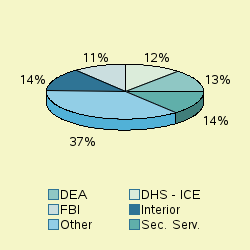
The lead investigative agency for government regulatory prosecutions through April 2020 was "Homeland Security - Secret Service (formerly Treasury)" accounting for 14 percent of prosecutions referred.
As shown in Figure 3, additional agencies with substantial numbers of government regulatory referrals were: Interior (13.6%), "Justice - Drug Enforcement Administration" (13.3%), "Homeland Security - Immigration and Customs Enforcement" (11.6%), "Justice - Federal Bureau of Investigation" (10.7%). The "Other" category in Figure 3 is comprised of a diverse group of agencies. The agencies with substantial numbers of government regulatory within the "Other" category were: Homeland Security - Other" (6.2%), "Treasury - Internal Revenue Service" (6.2%), "Agriculture" (3.3%), "Other - USAO District Transfer" (3.3%), "Justice - Alcohol, Tobacco, Firearms," (2.7%), "Commerce" (2.2%), "Postal Service" (2.2%).
Top Ranked Lead Charges
Table 2 shows the top lead charges recorded in the prosecutions of government regulatory matters filed in U.S. District Court during the first seven months of FY 2020.
Note: There were an additional 155 other lead charges which were not individually ranked. See latest monthly report if you want all lead charges included in rankings for the latest month, or use TRACFED criminal analyzer tool for complete listing for any year.
Lead Charge Count Rank 1 yr ago 5 yrs ago 10 yrs ago 20 yrs ago 18 USC 1956 - Laundering of monetary instruments 78 1 1 4 6 3 More Federal Regulation 60 2 2 1 1 11 More 18 USC 471 - Obligations or securities of United States 33 3 4 5 3 2 More 18 USC 472 - Uttering counterfeit obligations or securities 28 4 5 3 2 1 More 31 USC 5332 - Bulk Cash Smuggling into or out of the United States 26 5 6 6 7 - More Other US Code Section 25 6 3 2 19 22 More 21 USC 841 - Drug Abuse Prevention & Control-Prohibited acts A 20 7 20 37 25 80 More 21 USC 846 - Attempt and conspiracy 14 8 9 31 30 67 More 18 USC 371 - Conspiracy to commit offense or to defraud US 13 9 7 10 5 5 More 18 USC 554 - Smuggling goods from the United States 11 10 12 43 34 - More 18 USC 1957 - Monetary transactions w/property from unlawful act 11 10 28 26 51 33 More
Table 2: Top charges filed
"Laundering of monetary instruments" (Title 18 U.S.C Section 1956) was the most frequent recorded lead charge. Title 18 U.S.C Section 1956 was ranked 1st a year ago, while it was the 4th most frequently invoked five years ago. It was ranked 6th ten years ago and 3rd twenty years ago.
Ranked 2nd in frequency was the lead charge "Federal Regulation" under Title U.S.C Section. Title U.S.C Section was ranked 2nd a year ago, while it was the 1st most frequently invoked five years ago. It was ranked 1st ten years ago and 11th twenty years ago.
Ranked 3rd was "Obligations or securities of United States" under Title 18 U.S.C Section 471. Title 18 U.S.C Section 471 was ranked 4th a year ago, while it was the 5th most frequently invoked five years ago. It was ranked 3rd ten years ago and 2nd twenty years ago.
Again among the top ten lead charges, the one showing the sharpest projected decline in prosecutions compared to one year ago—down -50 percent—was "Other US Code Section " (Title . U.S.C Section . ). This was the same statute that had the largest projected decrease—-91%—when compared with five years ago.
Top Ranked Judicial Districts
During FY 2019 the Justice Department said the government obtained 3.1 government regulatory prosecutions for every one million people in the United States. If pace during the first seven months of FY 2020 continues at the same rate, government regulatory prosecutions for one million people in the United States this year will be 2.4 . Understandably, there is great variation in the per capita number of government regulatory prosecutions in each of the nation's ninety-four federal judicial districts
Judicial District Percapita Count Rank 1yr ago 5yrs ago 10yrs ago 20yrs ago Wyoming 154 52 1 1 1 1 2 More La, W 27 34 2 2 2 5 1 More D. C. 17 7 3 7 13 76 20 More Virg, W 11 14 4 27 75 87 47 More N. Y., S 11 33 5 5 28 15 17 More Kansas 9 16 6 15 39 36 27 More Idaho 8 8 7 35 20 11 9 More New Hamp 8 6 8 89 52 84 86 More Ala, M 7 5 9 48 11 59 70 More Wash, E 7 7 10 58 84 18 11 More
Table 3: Top 10 districts (per one million people)
The District of Wyoming—with 154.30 prosecutions as compared with 2.4 prosecutions per one million people in the United States—was the most active through April 2020. The District of Wyoming was ranked 1st a year ago as well as five years ago. The district's position ten years ago was 1st and 2nd twenty years ago.
The Western District of Louisiana (Shreveport) ranked 2nd. The Western District of Louisiana (Shreveport) was ranked 2nd a year ago as well as five years ago. The district's position ten years ago was 5th and 1st twenty years ago.
The District of Washington, D.C. (Washington) now ranks 3rd. The District of Washington, D.C. (Washington) was ranked 7th a year ago. The district's position ten years ago was 76th and 20th twenty years ago.
Recent entries to the top 10 list were Kansas, Western District of Virginia (Roanoke), Idaho, Middle District of Alabama (Montgomery), Eastern District of Washington (Spokane) and New Hampshire, now ranked 6th, 4th, 7th, 9th, 10th and 8th. These districts ranked 15th, 27th, 35th, 48th, 58th and 89th one year ago and 39th, 75th, 20th, 11th, 84th and 52nd five years ago.
Compared to 10 years ago, Idaho, Southern District of New York (Manhattan), Eastern District of Washington (Spokane), Kansas, Middle District of Alabama (Montgomery), Washington, D.C. (Washington), New Hampshire and Western District of Virginia (Roanoke) now ranked in the top 10 did not appear in the top ten.
And compared to 20 years ago, Eastern District of Washington (Spokane), Southern District of New York (Manhattan), Washington, D.C. (Washington), Kansas, Western District of Virginia (Roanoke), Middle District of Alabama (Montgomery) and New Hampshire were not sufficiently active to then make the top 10.
The federal judicial district which showed the greatest projected growth in the rate of government regulatory prosecutions compared to one year ago—499 percent—was Eastern District of Washington (Spokane). Compared to five years ago, the district with the largest projected growth—1089 percent—was Western District of Virginia (Roanoke) .
In the last year, the judicial District Court recording the largest projected drop in the rate of government regulatory prosecutions—59.5 percent—was Western District of Louisiana (Shreveport).
Report Generated: June 4, 2020