White Collar Crime Prosecutions for 2020
Number Year-to-date 2,563 Percent Change from previous year -22.9 Percent Change from 5 years ago -36.6 Percent Change from 10 years ago -54.8 Percent Change from 20 years ago -53.9
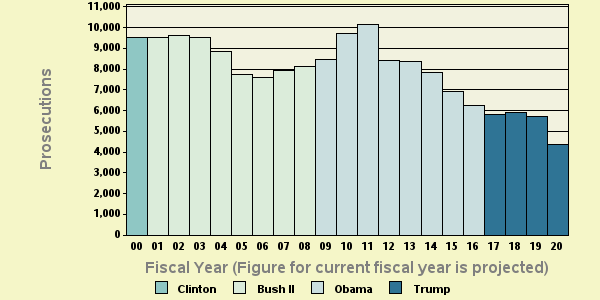
Table 1: Criminal White Collar Crime ProsecutionsThe latest available data from the Justice Department show that during the first seven months of FY 2020 the government reported 2,563 new white collar crime prosecutions. If this activity continues at the same pace, the annual total of prosecutions will be 4,394 for this fiscal year. According to the case-by-case information analyzed by the Transactional Records Access Clearinghouse (TRAC), this estimate is down 22.9% over the past fiscal year when the number of prosecutions totaled 5,702.
The comparisons of the number of defendants charged with white collar crime-r offenses are based on case-by-case information obtained by TRAC under the Freedom of Information Act from the Executive Office for United States Attorneys (see Table 1).
Compared to five years ago when there were 6,935, the estimate of FY 2020 prosecutions of this type is down 36.6 percent. Prosecutions over the past year are lower than they were ten years ago. Overall, the data show that prosecutions of this type are down 54.8 percent from the level of 9,722 reported in 2010 and down 53.9 percent from the level of 9,532 reported in 2000.
The long term trend in white collar crime prosecutions for these matters going back to FY 2000 is shown more clearly in Figure 1. The vertical bars in Figure 1 represent the number of white collar crime prosecutions of this type recorded each fiscal year. Projected figures for the current fiscal year are shown. Each presidential administration is distinguished by the color of the bars. To view trends month-by-month rather than year-by-year, see TRAC's monthly report series for the latest data.
Leading Program Categories
Within the broad category of white collar crime, cases were classified by prosecutors into more specific types.
Case types within white collar crime are
• Antitrust-Airlines
• Antitrust-Banking
• Antitrust-Defense Procurement
• Antitrust-Extraterritorial
• Antitrust-Other
• Antitrust-Other Finance Mkts.
• Fraud-Advance Fee Schemes
• Fraud-Against Ins. Provider
• Fraud-Arson for Profit
• Fraud-Bankruptcy
• Fraud-Commodities
• Fraud-Computer
• Fraud-Consumer
• Fraud-Corporate
• Fraud-Federal Procurement
• Fraud-Federal Program
• Fraud-Financial Institution
• Fraud-Health Care
• Fraud-Identity Theft-Aggravated
• Fraud-Identity Theft-Other
• Fraud-Insider Ins. Provider
• Fraud-Intellectual Property Violations
• Fraud-MEWA/MET
• Fraud-Mortgage
• Fraud-Other
• Fraud-Other Business
• Fraud-Other Insurance
• Fraud-Other Investment
• Fraud-Securities
• Fraud-Tax
• Fraud-Telemarketing
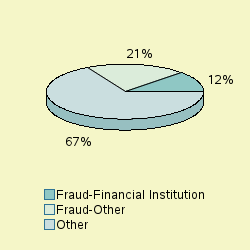
The single largest number of prosecutions of these matters through April 2020 was for "Fraud-Other", accounting for 20.7 percent of prosecutions.
As shown in Figure 2, the second largest number of matters were prosecutions filed under the program area of "Fraud-Financial Institution " (12.1%) . The "Other" category in Figure 2 is comprised of a diverse group of programs. The largest specific programs within the "Other" category were: Fraud-Identity Theft-Aggravated" (11%), "Fraud-Federal Program" (10.7%), "Fraud-Health Care" (9.1%), "Fraud-Tax" (8.4%), "Fraud-Identity Theft-Other" (5.8%), "Fraud-Other Business" (5.5%), "Fraud-Computer" (3.6%), "Fraud-Consumer" (2.7%). See Figure 2.
Leading Investigative Agencies
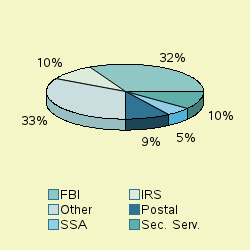
The lead investigative agency for white collar crime prosecutions through April 2020 was "Justice - Federal Bureau of Investigation" accounting for 32.3 percent of prosecutions referred.
As shown in Figure 3, additional agencies with substantial numbers of white collar crime referrals were: Homeland Security - Secret Service (formerly Treasury) (10.4%), "Treasury - Internal Revenue Service" (9.8%), "Postal Service" (9.2%), "Other - Social Security Administration" (5.2%). The "Other" category in Figure 3 is comprised of a diverse group of agencies. The agencies with substantial numbers of white collar crime within the "Other" category were: Health and Human Services" (4.2%), "Homeland Security - Customs and B" (3.9%), "Homeland Security - Other" (2.8%), "Homeland Security - Immigration an" (2.8%), "Agriculture" (2.2%).
Top Ranked Lead Charges
Table 2 shows the top lead charges recorded in the prosecutions of white collar crime matters filed in U.S. District Court during the first seven months of FY 2020.
Note: There were an additional 224 other lead charges which were not individually ranked. See latest monthly report if you want all lead charges included in rankings for the latest month, or use TRACFED criminal analyzer tool for complete listing for any year.
Lead Charge Count Rank 1 yr ago 5 yrs ago 10 yrs ago 20 yrs ago 18 USC 1343 - Fraud by wire, radio, or television 499 1 1 1 4 6 More 18 USC 1344 - Bank Fraud 228 2 2 3 2 1 More 18 USC 1349 - Mail Fraud - Attempt and Conspiracy 224 3 3 4 6 - More 18 USC 371 - Conspiracy to commit offense or to defraud US 139 4 6 6 5 4 More 18 USC 1029 - Fraud and related activity - access devices 137 5 4 5 8 5 More 18 USC 641 - Public money, property or records 119 6 7 2 9 11 More 18 USC 1028A - Aggravated Identity Theft 117 7 5 9 1 64 More 18 USC 1347 - Health Care Fraud 114 8 8 10 10 10 More 18 USC 1341 - Mail Fraud - Frauds and swindles 102 9 9 7 3 2 More 26 USC 7206 - Fraud and False statements 100 10 11 11 11 7 More
Table 2: Top charges filed
"Fraud by wire, radio, or television" (Title 18 U.S.C Section 1343) was the most frequent recorded lead charge. Title 18 U.S.C Section 1343 was ranked 1st a year ago, while it was the 1st most frequently invoked five years ago. It was ranked 4th ten years ago and 6th twenty years ago.
Ranked 2nd in frequency was the lead charge "Bank Fraud" under Title 18 U.S.C Section 1344. Title 18 U.S.C Section 1344 was ranked 2nd a year ago, while it was the 3rd most frequently invoked five years ago. It was ranked 2nd ten years ago and 1st twenty years ago.
Ranked 3rd was "Mail Fraud - Attempt and Conspiracy" under Title 18 U.S.C Section 1349. Title 18 U.S.C Section 1349 was ranked 3rd a year ago, while it was the 4th most frequently invoked five years ago. It was ranked 6th ten years ago.
Again among the top ten lead charges, the one showing the sharpest projected decline in prosecutions compared to one year ago—down -35 percent—was "Fraud and related activity - access devices " (Title 18 U.S.C Section 1029 ). This was the same statute that had the largest projected decrease—-62%—when compared with five years ago.
Top Ranked Judicial Districts
During FY 2019 the Justice Department said the government obtained 17.4 white collar crime prosecutions for every one million people in the United States. If pace during the first seven months of FY 2020 continues at the same rate, white collar crime prosecutions for one million people in the United States this year will be 13.4 . Understandably, there is great variation in the per capita number of white collar crime prosecutions in each of the nation's ninety-four federal judicial districts
Judicial District Percapita Count Rank 1yr ago 5yrs ago 10yrs ago 20yrs ago D. C. 49 20 1 4 51 4 1 More N. Y., S 46 140 2 1 1 3 2 More Mo, E 35 59 3 9 4 9 13 More Fla, N 34 37 4 46 28 37 52 More Okla, N 32 20 5 10 58 79 7 More Fla, S 30 133 6 3 2 2 12 More R. I. 29 18 7 2 64 80 80 More Arizona 27 115 8 12 12 1 82 More N. J. 26 134 9 47 59 55 47 More La, M 25 12 10 6 7 18 4 More
Table 3: Top 10 districts (per one million people)
The District of Washington, D.C. (Washington)—with 48.81 prosecutions as compared with 13.4 prosecutions per one million people in the United States—was the most active through April 2020. The District of Washington, D.C. (Washington) was ranked 4th a year ago. The district's position ten years ago was 4th and 1st twenty years ago.
The Southern District of New York (Manhattan) ranked 2nd. The Southern District of New York (Manhattan) was ranked 1st a year ago as well as five years ago. The district's position ten years ago was 3rd and 2nd twenty years ago.
The Eastern District of Missouri (St. Louis) now ranks 3rd. The Eastern District of Missouri (St. Louis) was ranked 9th a year ago, while it was ranked 4th five years ago. The district's position ten years ago was 9th and 13th twenty years ago.
Recent entries to the top 10 list were Arizona, Northern District of Florida (Pensacola) and New Jersey, now ranked 8th, 4th and 9th. These districts ranked 12th, 46th and 47th one year ago and 12th, 28th and 59th five years ago.
Compared to 10 years ago, Middle District of Louisiana (Baton Rouge), Northern District of Florida (Pensacola), New Jersey, Northern District of Oklahoma (Tulsa) and Rhode Island now ranked in the top 10 did not appear in the top ten.
And compared to 20 years ago, Southern District of Florida (Miami), Eastern District of Missouri (St. Louis), New Jersey, Northern District of Florida (Pensacola), Rhode Island and Arizona were not sufficiently active to then make the top 10.
The federal judicial district which showed the greatest projected growth in the rate of white collar crime prosecutions compared to one year ago—111 percent—was Northern District of Florida (Pensacola). Compared to five years ago, the district with the largest projected growth—175 percent—was Washington, D.C. (Washington) .
In the last year, the judicial District Court recording the largest projected drop in the rate of white collar crime prosecutions—42.9 percent—was Rhode Island.
Report Generated: June 4, 2020