Immigration Prosecutions for 2023
Number Year-to-date 25,717 Percent Change from previous year 7.9 Percent Change from 5 years ago -72.1 Percent Change from 10 years ago -71.2 Percent Change from 20 years ago 34.7
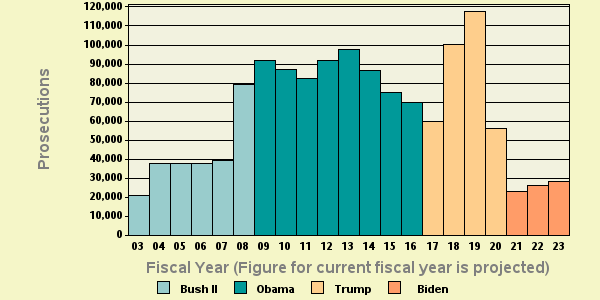
Table 1: Criminal Immigration ProsecutionsThe latest available data from the Justice Department show that during the first eleven months of FY 2023 the government reported 25,717 new immigration prosecutions. If this activity continues at the same pace, the annual total of prosecutions will be 28,055 for this fiscal year. According to the case-by-case information analyzed by the Transactional Records Access Clearinghouse (TRAC), this estimate is up 7.9% over the past fiscal year when the number of prosecutions totaled 25,995.
The comparisons of the number of defendants charged with immigration-related offenses are based on case-by-case information obtained by TRAC under the Freedom of Information Act from the Executive Office for United States Attorneys (see Table 1).
Compared to five years ago when there were 100,453, the estimate of FY 2023 prosecutions of this type is down 72.1 percent. Prosecutions over the past year are much lower than they were ten years ago. Overall, the data show that prosecutions of this type are down 71.2 percent from the level of 97,384 reported in 2013 but up 34.7 percent from the level of 20,833 reported in 2003.
The long term trend in immigration prosecutions for these matters going back to FY 2003 is shown more clearly in Figure 1. The vertical bars in Figure 1 represent the number of immigration prosecutions of this type recorded each fiscal year. Projected figures for the current fiscal year are shown. Each presidential administration is distinguished by the color of the bars. To view trends month-by-month rather than year-by-year, see TRAC's monthly report series for the latest data.
Leading Program Categories
Within the broad category of immigration, cases were classified by prosecutors into more specific types.
The single largest number of prosecutions of these matters through August 2023 was for "Immigration", accounting for all prosecutions.
Leading Investigative Agencies
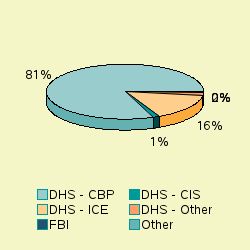
The lead investigative agency for immigration prosecutions through August 2023 was "Homeland Security - Customs and Border Protection" accounting for 80.8 percent of prosecutions referred.
As shown in Figure 2, additional agencies with substantial numbers of immigration referrals were: Homeland Security - Immigration and Customs Enforcement (15.7%).
Top Ranked Lead Charges
Table 2 shows the top lead charges recorded in the prosecutions of immigration matters filed in U.S. District Court during the first eleven months of FY 2023.
Note: There were an additional 74 other lead charges which were not individually ranked. See latest monthly report if you want all lead charges included in rankings for the latest month, or use TRACFED criminal analyzer tool for complete listing for any year.
Lead Charge Count Rank 1 yr ago 5 yrs ago 10 yrs ago 20 yrs ago 08 USC 1326 - Reentry of deported alien 17,883 1 1 2 2 1 More 08 USC 1324 - Bringing in and harboring certain aliens 5,797 2 2 3 3 3 More 08 USC 1325 - Entry of alien at improper time or place; etc. 1,183 3 3 1 1 2 More 18 USC 1546 - Fraud and misuse of visas, permits, and other documents 282 4 4 4 4 4 More 18 USC 1001 - Fraud/false statements or entries generally 186 5 5 12 10 5 More 19 USC 1459 - Reporting requirements for individuals 105 6 6 11 20 - More 18 USC 911 - False personification - Citizen of the US 38 7 8 24 7 6 More 18 USC 1544 - Misuse of passport 23 8 7 5 5 14 More 18 USC 922 - Firearms; Unlawful acts 22 9 8 9 12 15 More 18 USC 3 - Accessory after the fact 18 10 25 14 25 44 More
Table 2: Top charges filed
"Reentry of deported alien" (Title 8 U.S.C Section 1326) was the most frequent recorded lead charge. Title 8 U.S.C Section 1326 was ranked 1st a year ago, while it was the 2nd most frequently invoked five years ago. It was ranked 2nd ten years ago and 1st twenty years ago.
Ranked 2nd in frequency was the lead charge "Bringing in and harboring certain aliens" under Title 8 U.S.C Section 1324. Title 8 U.S.C Section 1324 was ranked 2nd a year ago, while it was the 3rd most frequently invoked five years ago. It was ranked 3rd ten years ago and 3rd twenty years ago.
Ranked 3rd was "Entry of alien at improper time or place; etc." under Title 8 U.S.C Section 1325. Title 8 U.S.C Section 1325 was ranked 3rd a year ago, while it was the 1st most frequently invoked five years ago. It was ranked 1st ten years ago and 2nd twenty years ago.
Again among the top ten lead charges, the one showing the sharpest projected decline in prosecutions compared to one year ago—down -65 percent—was "Misuse of passport " (Title 18 U.S.C Section 1544 ). This was the same statute that had the largest projected decrease—-98%—when compared with five years ago.
Top Ranked Judicial Districts
Understandably, there is great variation in the number of immigration prosecutions in each of the nation's ninety-four federal judicial districts. The districts registering the largest number of prosecutions of this type during the first eleven months of FY 2023 are shown in Table 3.
Judicial District Count Rank 1yr ago 5yrs ago 10yrs ago 20yrs ago Arizona 8,068 1 1 3 3 4 More Texas, W 6,243 2 2 2 2 2 More Texas, S 5,008 3 3 1 1 1 More N Mexico 1,790 4 4 5 4 5 More Cal, S 1,629 5 5 4 5 3 More N. Y., N 546 6 6 8 16 16 More Fla, S 317 7 7 6 6 6 More Fla, M 144 8 8 7 9 11 More Texas, N 128 9 9 9 8 8 More Utah 123 10 11 11 12 14 More
Table 3: Top 10 districts
The District of Arizona—with 8,068 prosecutions—was the most active through August 2023. The District of Arizona was ranked 1st a year ago, while it was ranked 3rd five years ago. The district's position ten years ago was 3rd and 4th twenty years ago.
The Western District of Texas (San Antonio) ranked 2nd. The Western District of Texas (San Antonio) was ranked 2nd a year ago as well as five years ago. The district's position ten years ago was 2nd as well as twenty years ago.
The Southern District of Texas (Houston) now ranks 3rd. The Southern District of Texas (Houston) was ranked 3rd a year ago, while it was ranked 1st five years ago. The district's position ten years ago was 1st as well as twenty years ago.
A recent entry to the top 10 list was Utah, now ranked 10th. This district ranked 11th one year ago and 11th five years ago.
Compared to 10 years ago, Utah and Northern District of New York (Syracuse) now ranked in the top 10 did not appear in the top ten.
And compared to 20 years ago, Middle District of Florida (Tampa), Utah and Northern District of New York (Syracuse) were not sufficiently active to then make the top 10.
The federal judicial district which showed the greatest projected growth in immigration prosecutions compared to one year ago—52.5 percent—was Utah. Compared to five years ago, the district with the largest projected growth—109 percent—was Northern District of New York (Syracuse) .
In the last year, the judicial District Court recording the largest projected drop in immigration prosecutions—7.37 percent—was Southern District of Texas (Houston).
Report Generated: November 12, 2023