Weapons Convictions for 2020
Number Year-to-date 5,095 Percent Change from previous year 0.4 Percent Change from 5 years ago 45.5 Percent Change from 10 years ago 23 Percent Change from 20 years ago 121
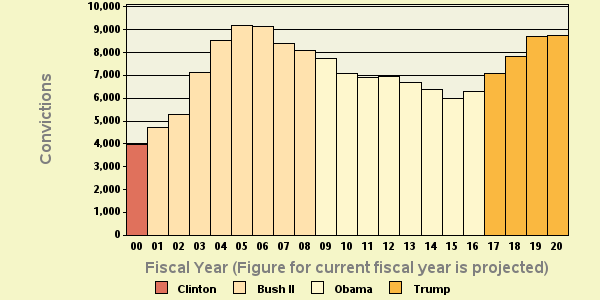
Table 1: Criminal Weapons ConvictionsThe latest available data from the Justice Department show that during the first seven months of FY 2020 the government reported 5,095 new weapons convictions. If this activity continues at the same pace, the annual total of convictions will be 8,734 for this fiscal year. According to the case-by-case information analyzed by the Transactional Records Access Clearinghouse (TRAC), this estimate is up 0.4% over the past fiscal year when the number of convictions totaled 8,697.
The comparisons of the number of defendants convicted for weapons-related offenses are based on case-by-case information obtained by TRAC under the Freedom of Information Act from the Executive Office for United States Attorneys (see Table 1).
Compared to five years ago when there were 6,002, the estimate of FY 2020 convictions of this type is up 45.5 percent. Convictions over the past year are higher than they were ten years ago. Overall, the data show that convictions of this type are up 23 percent from the level of 7,101 reported in 2010 and up 121 percent from the level of 3,959 reported in 2000.
The long term trend in weapons convictions for these matters going back to FY 2000 is shown more clearly in Figure 1. The vertical bars in Figure 1 represent the number of weapons convictions of this type recorded each fiscal year. Projected figures for the current fiscal year are shown. Each presidential administration is distinguished by the color of the bars. To view trends month-by-month rather than year-by-year, see TRAC's monthly report series for the latest data.
Leading Program Categories
Within the broad category of weapons, cases were classified by prosecutors into more specific types.
Case types within weapons are
Weapons-Armed Career Criminal Act
Weapons-Operation Triggerlock Major
Weapons-Operation Triggerlock Other
The single largest number of convictions of these matters through April 2020 was for "Weapons-Operation Triggerlock Major", accounting for all convictions.
Leading Investigative Agencies
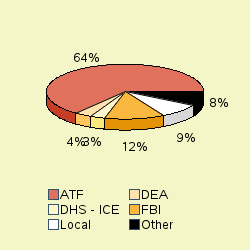
The lead investigative agency for weapons convictions through April 2020 was "Justice - Alcohol, Tobacco, Firearms, and Explosives (formerly Treasury)" accounting for 64.2 percent of convictions.
As shown in Figure 2, additional agencies with substantial numbers of weapons convictions were: Justice - Federal Bureau of Investigation (12.3%), "Other - State/Local Authorities" (8.7%), "Justice - Drug Enforcement Administration" (3.6%), "Homeland Security - Immigration and Customs Enforcement" (2.9%).
Top Ranked Lead Charges
Table 2 shows the top lead charges recorded in the convictions of weapons matters filed in U.S. District Court during the first seven months of FY 2020.
Note: There were an additional 82 other lead charges which were not individually ranked. See latest monthly report if you want all lead charges included in rankings for the latest month, or use TRACFED criminal analyzer tool for complete listing for any year.
Lead Charge Count Rank 1 yr ago 5 yrs ago 10 yrs ago 20 yrs ago 18 USC 922 - Firearms; Unlawful acts 4,119 1 1 1 1 1 More 18 USC 924 - Firearms; Penalties 181 2 2 2 2 2 More 18 USC 1951 - Hobbs Act 160 3 3 3 4 6 More Other US Code Section 141 4 5 14 16 14 More 21 USC 841 - Drug Abuse Prevention & Control-Prohibited acts A 130 5 4 4 3 3 More 21 USC 846 - Attempt and conspiracy 71 6 7 6 6 4 More 18 USC 554 - Smuggling goods from the United States 68 7 8 9 9 - More 26 USC 5861 - Tax on Making Firearms - Prohibited acts 58 8 6 5 5 5 More 18 USC 2119 - Carjacking 35 9 9 8 11 8 More 18 USC 371 - Conspiracy to commit offense or to defraud US 27 10 10 7 7 9 More
Table 2: Top charges for convictions
"Firearms; Unlawful acts" (Title 18 U.S.C Section 922) was the most frequent recorded lead charge. Title 18 U.S.C Section 922 was ranked 1st a year ago, while it was the 1st most frequently invoked five years ago. It was ranked 1st ten years ago and 1st twenty years ago.
Ranked 2nd in frequency was the lead charge "Firearms; Penalties" under Title 18 U.S.C Section 924. Title 18 U.S.C Section 924 was ranked 2nd a year ago, while it was the 2nd most frequently invoked five years ago. It was ranked 2nd ten years ago and 2nd twenty years ago.
Ranked 3rd was "Hobbs Act" under Title 18 U.S.C Section 1951. Title 18 U.S.C Section 1951 was ranked 3rd a year ago, while it was the 3rd most frequently invoked five years ago. It was ranked 4th ten years ago and 6th twenty years ago.
Again among the top ten lead charges, the one showing the sharpest projected decline in convictions compared to one year ago—down -27 percent—was "Firearms; Penalties " (Title 18 U.S.C Section 924 ). This was the same statute that had the largest projected decrease—-7.4%—when compared with five years ago.
Top Ranked Judicial Districts
During FY 2019 the Justice Department said the government obtained 26.6 weapons convictions for every one million people in the United States. If pace during the first seven months of FY 2020 continues at the same rate, weapons convictions for one million people in the United States this year will be 26.7 . Understandably, there is great variation in the per capita number of weapons convictions in each of the nation's ninety-four federal judicial districts
Judicial District Percapita Count Rank 1yr ago 5yrs ago 10yrs ago 20yrs ago Mo, E 193 329 1 1 14 4 17 More D. C. 139 57 2 8 46 65 1 More Ala, S 126 62 3 2 1 7 11 More Iowa, N 106 82 4 4 6 30 13 More Tenn, W 84 77 5 3 2 1 30 More S Dakota 79 40 6 14 10 31 38 More Montana 74 46 7 7 7 14 8 More Ark, E 73 70 8 18 32 23 47 More W Virg, S 72 37 9 25 24 34 6 More W Virg, N 70 38 10 22 12 12 4 More
Table 3: Top 10 districts (per one million people)
The Eastern District of Missouri (St. Louis)—with 192.72 convictions as compared with 26.7 convictions per one million people in the United States—was the most active through April 2020. The Eastern District of Missouri (St. Louis) was ranked 1st a year ago. The district's position ten years ago was 4th and 17th twenty years ago.
The District of Washington, D.C. (Washington) ranked 2nd. The District of Washington, D.C. (Washington) was ranked 8th a year ago. The district's position ten years ago was 65th and 1st twenty years ago.
The Southern District of Alabama (Mobile) now ranks 3rd. The Southern District of Alabama (Mobile) was ranked 2nd a year ago, while it was ranked 1st five years ago. The district's position ten years ago was 7th and 11th twenty years ago.
Recent entries to the top 10 list were South Dakota, Eastern District of Arkansas (Little Rock), Northern District of West Virginia (Wheeling) and Southern District of West Virginia (Charleston), now ranked 6th, 8th, 10th and 9th. These districts ranked 14th, 18th, 22nd and 25th one year ago and 10th, 32nd, 12th and 24th five years ago.
Compared to 10 years ago, Northern District of West Virginia (Wheeling), Montana, Eastern District of Arkansas (Little Rock), Northern District of Iowa (Cedar Rapids), South Dakota, Southern District of West Virginia (Charleston) and Washington, D.C. (Washington) now ranked in the top 10 did not appear in the top ten.
And compared to 20 years ago, Southern District of Alabama (Mobile), Northern District of Iowa (Cedar Rapids), Eastern District of Missouri (St. Louis), Western District of Tennessee (Memphis), South Dakota and Eastern District of Arkansas (Little Rock) were not sufficiently active to then make the top 10.
The federal judicial district which showed the greatest projected growth in the rate of weapons convictions compared to one year ago—84.4 percent—was Washington, D.C. (Washington). This was the same district that had the largest projected increase—623%—when compared with five years ago.
In the last year, the judicial District Court recording the largest projected drop in the rate of weapons convictions—32.0 percent—was Western District of Tennessee (Memphis).
Report Generated: June 22, 2020