Immigration Prosecutions for 2018
Number Year-to-date 89,113 Percent Change from previous year 62.3 Percent Change from 5 years ago -0.2 Percent Change from 10 years ago 22.4 Percent Change from 20 years ago 579
Table 1: Criminal Immigration ProsecutionsThe latest available data from the Justice Department show that during the first eleven months of FY 2018 the government reported 89,113 new immigration prosecutions. If this activity continues at the same pace, the annual total of prosecutions will be 97,214 for this fiscal year. According to the case-by-case information analyzed by the Transactional Records Access Clearinghouse (TRAC), this estimate is up 62.3% over the past fiscal year when the number of prosecutions totaled 59,910.
The comparisons of the number of defendants charged with immigration-related offenses are based on case-by-case information obtained by TRAC under the Freedom of Information Act from the Executive Office for United States Attorneys (see Table 1).
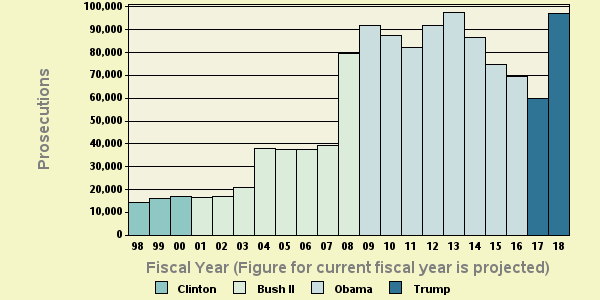
Compared to five years ago when there were 97,384, the estimate of FY 2018 prosecutions of this type is down 0.2 percent. Prosecutions over the past year are still higher than they were ten years ago. Overall, the data show that prosecutions of this type are up 22.4 percent from the level of 79,431 reported in 2008 and up 579 percent from the level of 14,309 reported in 1998.
The long term trend in immigration prosecutions for these matters going back to FY 1998 is shown more clearly in Figure 1. The vertical bars in Figure 1 represent the number of immigration prosecutions of this type recorded each fiscal year. Projected figures for the current fiscal year are shown. Each presidential administration is distinguished by the color of the bars. To view trends month-by-month rather than year-by-year, see TRAC's monthly report series for the latest data.
Leading Investigative Agencies
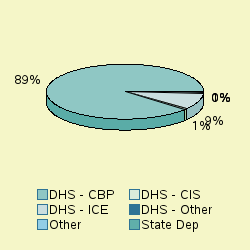
The lead investigative agency for immigration prosecutions through August 2018 was "Homeland Security - Customs and Border Protection" accounting for 88.6 percent of prosecutions referred.
As shown in Figure 2, additional agencies with substantial numbers of immigration referrals were: Homeland Security - Immigration and Customs Enforcement (9.4%).
Top Ranked Lead Charges
Table 2 shows the top lead charges recorded in the prosecutions of immigration matters filed in U.S. District Court during the first eleven months of FY 2018.
Note: There were an additional 82 other lead charges which were not individually ranked. See latest monthly report if you want all lead charges included in rankings for the latest month, or use TRACFED criminal analyzer tool for complete listing for any year.
Lead Charge Count Rank 1 yr ago 5 yrs ago 10 yrs ago 20 yrs ago 08 USC 1325 - Entry of alien at improper time or place; etc. 54,076 1 2 1 1 2 More 08 USC 1326 - Reentry of deported alien 29,039 2 1 2 2 1 More 08 USC 1324 - Bringing in and harboring certain aliens 4,131 3 3 3 3 3 More 18 USC 1546 - Fraud and misuse of visas, permits, and other documents 703 4 4 4 4 4 More 18 USC 1544 - Misuse of passport 358 5 5 5 13 23 More 18 USC 1542 - False statement in application and use of passport 69 6 7 8 8 7 More 18 USC 1028 - Fraud and related activity - id documents 66 7 6 6 5 6 More Other US Code Section 63 8 17 19 19 14 More 18 USC 922 - Firearms; Unlawful acts 62 9 8 12 16 16 More 18 USC 3144 - Release or detention of a material witness 58 10 12 22 17 13 More
Table 2: Top charges filed
"Entry of alien at improper time or place; etc." (Title 8 U.S.C Section 1325) was the most frequent recorded lead charge. Title 8 U.S.C Section 1325 was ranked 2nd a year ago, while it was the 1st most frequently invoked five years ago. It was ranked 1st ten years ago and 2nd twenty years ago.
Ranked 2nd in frequency was the lead charge "Reentry of deported alien" under Title 8 U.S.C Section 1326. Title 8 U.S.C Section 1326 was ranked 1st a year ago, while it was the 2nd most frequently invoked five years ago. It was ranked 2nd ten years ago and 1st twenty years ago.
Ranked 3rd was "Bringing in and harboring certain aliens" under Title 8 U.S.C Section 1324. Title 8 U.S.C Section 1324 was ranked 3rd a year ago, while it was the 3rd most frequently invoked five years ago. It was ranked 3rd ten years ago and 3rd twenty years ago.
Again among the top ten lead charges, the one showing the sharpest projected decline in prosecutions compared to one year ago—down -29 percent—was "Fraud and related activity - id documents " (Title 18 U.S.C Section 1028 ). This was the same statute that had the largest projected decrease—-80%—when compared with five years ago.
Top Ranked Judicial Districts
During FY 2017 the Justice Department said the government obtained 185.4 immigration prosecutions for every one million people in the United States. If pace during the first eleven months of FY 2018 continues at the same rate, immigration prosecutions for one million people in the United States this year will be 300.9 . Understandably, there is great variation in the per capita number of immigration prosecutions in each of the nation's ninety-four federal judicial districts
Judicial District Percapita Count Rank 1yr ago 5yrs ago 10yrs ago 20yrs ago N Mexico 4,023 7,674 1 3 4 3 4 More Texas, S 3,425 30,174 2 4 2 2 5 More Texas, W 3,208 20,863 3 2 1 1 3 More Arizona 2,586 16,429 4 1 3 4 2 More Cal, S 2,380 7,634 5 5 5 5 1 More Vermont 140 80 6 19 21 14 24 More Wyoming 101 54 7 9 7 12 19 More N. Y., N 82 255 8 16 18 19 10 More Fla, S 82 548 9 8 9 10 21 More Utah 77 215 10 6 10 7 6 More
Table 3: Top 10 districts (per one million people)
The District of New Mexico—with 4,022.86 prosecutions as compared with 300.9 prosecutions per one million people in the United States—was the most active through August 2018. The District of New Mexico was ranked 3rd a year ago, while it was ranked 4th five years ago. The district's position ten years ago was 3rd and 4th twenty years ago.
The Southern District of Texas (Houston) ranked 2nd. The Southern District of Texas (Houston) was ranked 4th a year ago, while it was ranked 2nd five years ago. The district's position ten years ago was 2nd and 5th twenty years ago.
The Western District of Texas (San Antonio) now ranks 3rd. The Western District of Texas (San Antonio) was ranked 2nd a year ago, while it was ranked 1st five years ago. The district's position ten years ago was 1st and 3rd twenty years ago.
Recent entries to the top 10 list were Northern District of New York (Syracuse) and Vermont, now ranked 8th and 6th. These districts ranked 16th and 19th one year ago and 18th and 21st five years ago.
Compared to 10 years ago, Wyoming, Vermont and Northern District of New York (Syracuse) now ranked in the top 10 did not appear in the top ten.
And compared to 20 years ago, Wyoming, Southern District of Florida (Miami) and Vermont were not sufficiently active to then make the top 10.
The federal judicial district which showed the greatest projected growth in the rate of immigration prosecutions compared to one year ago—297 percent—was Vermont. This was the same district that had the largest projected increase—202%—when compared with five years ago.
In the last year, the judicial District Court recording the largest projected drop in the rate of immigration prosecutions—28.5 percent—was Utah.
Report Generated: October 23, 2018