Drugs-Drug Trafficking Prosecutions for 2018
Number Year-to-date 12,758 Percent Change from previous year -3.4 Percent Change from 5 years ago -17.8 Percent Change from 10 years ago -20.7 Percent Change from 20 years ago -30.9
Table 1: Criminal Drugs-Drug Trafficking ProsecutionsThe latest available data from the Justice Department show that during the first ten months of FY 2018 the government reported 12,758 new drugs-drug trafficking prosecutions. If this activity continues at the same pace, the annual total of prosecutions will be 15,310 for this fiscal year. According to the case-by-case information analyzed by the Transactional Records Access Clearinghouse (TRAC), this estimate is down 3.4% over the past fiscal year when the number of prosecutions totaled 15,844.
The comparisons of the number of defendants charged with drugs-drug trafficki offenses are based on case-by-case information obtained by TRAC under the Freedom of Information Act from the Executive Office for United States Attorneys (see Table 1).
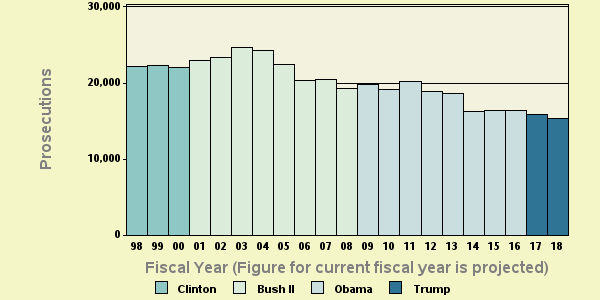
Compared to five years ago when there were 18,631, the estimate of FY 2018 prosecutions of this type is down 17.8 percent. Prosecutions over the past year are lower than they were ten years ago. Overall, the data show that prosecutions of this type are down 20.7 percent from the level of 19,304 reported in 2008 and down 30.9 percent from the level of 22,145 reported in 1998.
The long term trend in drugs-drug trafficking prosecutions for these matters going back to FY 1998 is shown more clearly in Figure 1. The vertical bars in Figure 1 represent the number of drugs-drug trafficking prosecutions of this type recorded each fiscal year. Projected figures for the current fiscal year are shown. Each presidential administration is distinguished by the color of the bars. To view trends month-by-month rather than year-by-year, see TRAC's monthly report series for the latest data.
Leading Investigative Agencies
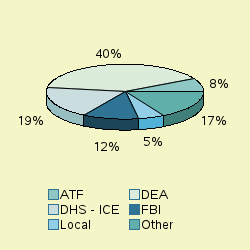
The lead investigative agency for drugs-drug trafficking prosecutions through July 2018 was "Justice - Drug Enforcement Administration" accounting for 40.1 percent of prosecutions referred.
As shown in Figure 2, additional agencies with substantial numbers of drugs-drug trafficking referrals were: Homeland Security - Immigration and Customs Enforcement (18.5%), "Justice - Federal Bureau of Investigation" (11.5%), "Justice - Alcohol, Tobacco, Firearms, and Explosives (formerly Treasury)" (7.7%), "Other - State/Local Authorities" (5.4%). The "Other" category in Figure 2 is comprised of a diverse group of agencies. The agencies with substantial numbers of drugs-drug trafficking within the "Other" category were: Homeland Security - Customs and B" (5.2%), "Homeland Security - Other" (4.4%).
Top Ranked Lead Charges
Table 2 shows the top lead charges recorded in the prosecutions of drugs-drug trafficking matters filed in U.S. District Court during the first ten months of FY 2018.
Note: There were an additional 105 other lead charges which were not individually ranked. See latest monthly report if you want all lead charges included in rankings for the latest month, or use TRACFED criminal analyzer tool for complete listing for any year.
Lead Charge Count Rank 1 yr ago 5 yrs ago 10 yrs ago 20 yrs ago 21 USC 841 - Drug Abuse Prevention & Control-Prohibited acts A 7,014 1 1 1 1 1 More 21 USC 846 - Attempt and conspiracy 3,613 2 2 2 2 2 More 21 USC 952 - Importation of controlled substances 1,351 3 3 3 3 3 More 18 USC 922 - Firearms; Unlawful acts 174 4 4 6 8 11 More Other US Code Section 103 5 9 10 13 7 More 21 USC 963 - Attempt and conspiracy 88 6 5 4 4 4 More 46 USC 70503 - Possession control substance on vessel subject to jurisdiction of US 67 7 6 14 21 - More 18 USC 924 - Firearms; Penalties 42 8 8 7 7 13 More 21 USC 843 - Drug Abuse Prevention & Control-Prohibited acts C 36 9 7 5 6 6 More 18 USC 3583 - Term of supervised release after imprisonment 30 10 11 24 18 24 More
Table 2: Top charges filed
"Drug Abuse Prevention & Control-Prohibited acts A" (Title 21 U.S.C Section 841) was the most frequent recorded lead charge. Title 21 U.S.C Section 841 was ranked 1st a year ago, while it was the 1st most frequently invoked five years ago. It was ranked 1st ten years ago and 1st twenty years ago.
Ranked 2nd in frequency was the lead charge "Attempt and conspiracy" under Title 21 U.S.C Section 846. Title 21 U.S.C Section 846 was ranked 2nd a year ago, while it was the 2nd most frequently invoked five years ago. It was ranked 2nd ten years ago and 2nd twenty years ago.
Ranked 3rd was "Importation of controlled substances" under Title 21 U.S.C Section 952. Title 21 U.S.C Section 952 was ranked 3rd a year ago, while it was the 3rd most frequently invoked five years ago. It was ranked 3rd ten years ago and 3rd twenty years ago.
Again among the top ten lead charges, the one showing the sharpest projected decline in prosecutions compared to one year ago—down -29 percent—was "Term of supervised release after imprisonment " (Title 18 U.S.C Section 3583 ). This was the same statute that had the largest projected decrease—-46%—when compared with five years ago.
Top Ranked Judicial Districts
During FY 2017 the Justice Department said the government obtained 49 drugs-drug trafficking prosecutions for every one million people in the United States. If pace during the first ten months of FY 2018 continues at the same rate, drugs-drug trafficking prosecutions for one million people in the United States this year will be 47.4 . Understandably, there is great variation in the per capita number of drugs-drug trafficking prosecutions in each of the nation's ninety-four federal judicial districts
Judicial District Percapita Count Rank 1yr ago 5yrs ago 10yrs ago 20yrs ago Cal, S 433 1,262 1 1 1 2 1 More Texas, W 186 1,097 2 4 5 1 2 More Arizona 182 1,050 3 2 2 14 6 More N Mexico 150 260 4 3 3 3 5 More S Dakota 116 82 5 5 19 18 45 More Montana 113 98 6 18 20 29 30 More Iowa, S 108 162 7 11 41 26 17 More N. Y., S 105 459 8 8 9 15 13 More Alaska 103 62 9 23 23 12 25 More Ala, S 101 71 10 9 14 5 7 More
Table 3: Top 10 districts (per one million people)
The Southern District of California (San Diego)—with 432.85 prosecutions as compared with 47.4 prosecutions per one million people in the United States—was the most active through July 2018. The Southern District of California (San Diego) was ranked 1st a year ago as well as five years ago. The district's position ten years ago was 2nd and 1st twenty years ago.
The Western District of Texas (San Antonio) ranked 2nd. The Western District of Texas (San Antonio) was ranked 4th a year ago, while it was ranked 5th five years ago. The district's position ten years ago was 1st and 2nd twenty years ago.
The District of Arizona now ranks 3rd. The District of Arizona was ranked 2nd a year ago as well as five years ago. The district's position ten years ago was 14th and 6th twenty years ago.
Recent entries to the top 10 list were Southern District of Iowa (Des Moines), Montana and Alaska, now ranked 7th, 6th and 9th. These districts ranked 11th, 18th and 23rd one year ago and 41st, 20th and 23rd five years ago.
Compared to 10 years ago, Alaska, Arizona, Southern District of New York (Manhattan), South Dakota, Southern District of Iowa (Des Moines) and Montana now ranked in the top 10 did not appear in the top ten.
And compared to 20 years ago, Southern District of New York (Manhattan), Southern District of Iowa (Des Moines), Alaska, Montana and South Dakota were not sufficiently active to then make the top 10.
The federal judicial district which showed the greatest projected growth in the rate of drugs-drug trafficking prosecutions compared to one year ago—65.3 percent—was Alaska. Compared to five years ago, the district with the largest projected growth—192 percent—was Southern District of Iowa (Des Moines) .
In the last year, the judicial District Court recording the largest projected drop in the rate of drugs-drug trafficking prosecutions—37.7 percent—was New Mexico.
Report Generated: August 28, 2018