Search Results for "crack"
The examination of TRAC's Criminal enforcement database prompted by your inquiry located a total of 8787 records that matched the search phrase, "crack". The search was restricted to only a portion of TRAC's Criminal database -- workload handled in fiscal year 2004. Additional periods can be searched. (Links are provided at the bottom of this page which allow you to repeat this search for other time periods.) Each record corresponds to a single individual and is based on information obtained by TRAC from the Justice Department, the Administrative Office of the U.S. Courts, and a variety of other sources. Given the complexity of the underlying material, we suggest you check the case-by-case data in this listing to make sure that the information you get in response to your query is in line with what you expected. Workload Table 1 shows that in fiscal year 2004, a total of 8787 individuals were recorded in TRAC's database at different stages in the Criminal justice system for those cases matching your search. During this period, a total of 1372 defendants were newly referred by the investigative agencies and assigned to U.S. Attorney offices, and 7415 individuals had cases in process from prior periods. Work was in one way or another completed and cases were disposed of for 1021 individuals,
and 7766 were still pending at the end of the period.
Actions Taken Table 2 shows that during this period,
prosecutors acted on the government's case against 1294 individuals.
For 1162 of that total (or 90 percent) prosecutions were filed in court.
Some or all of these cases may still be pending.
For the remaining 132 (or 10 percent), the cases were closed without a prosecution being filed.
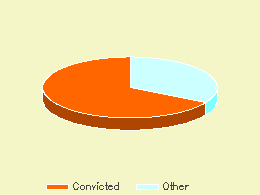
Outcome Table 3 and the pie chart focus on the 1021 cases that were closed or disposed of during the period.
For 132 individuals (or 13 percent),
federal prosecutors declined to prosecute.
For 47 individuals (or 5 percent), the cases were dismissed by the court.
For 828 cases (or 81 percent), the defendants were convicted,
8 were found not guilty (or 1 percent),
and 6 (or 1 percent) had other dispositions.
Continue your analysis by using the following links:
|
||||||||||||||||||||||||||||||||||||||||||||||||||||||||||||||
