Prosecutions for 2018
Referring Agency: Internal Revenue Service
Number Year-to-date 665 Percent Change from previous year -21.2 Percent Change from 5 years ago -55.9 Percent Change from 10 years ago -35.2 Percent Change from 20 years ago -51.8
Table 1: Criminal ProsecutionsThe latest available data from the Justice Department show that during the first nine months of FY 2018 the government reported 665 new prosecutions for these matters. Those cases were referred by the Internal Revenue Service. If this activity continues at the same pace, the annual total of prosecutions will be 887 for this fiscal year. According to the case-by-case information analyzed by the Transactional Records Access Clearinghouse (TRAC), this estimate is down 21.2% over the past fiscal year when the number of prosecutions totaled 1,126.
The comparisons of the number of defendants charged with offenses are based on case-by-case information obtained by TRAC under the Freedom of Information Act from the Executive Office for United States Attorneys (see Table 1).
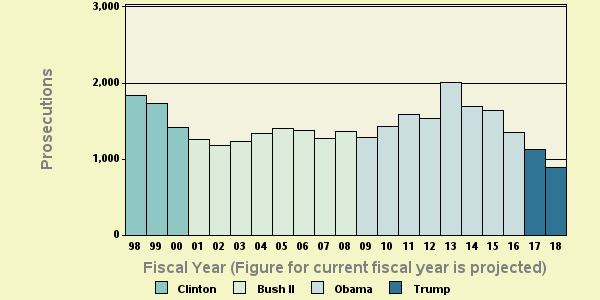
Compared to five years ago when there were 2,010, the estimate of FY 2018 prosecutions of this type is down 55.9 percent. Prosecutions over the past year are lower than they were ten years ago. Overall, the data show that prosecutions of this type are down 35.2 percent from the level of 1,368 reported in 2008 and down 51.8 percent from the level of 1,842 reported in 1998.
The long term trend in prosecutions for these matters going back to FY 1998 is shown more clearly in Figure 1. The vertical bars in Figure 1 represent the number of prosecutions of this type recorded each fiscal year. Projected figures for the current fiscal year are shown. Each presidential administration is distinguished by the color of the bars. To view trends month-by-month rather than year-by-year, see TRAC's monthly report series for the latest data.
Leading Program Areas
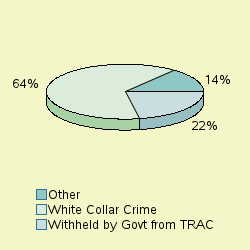
Cases were classified by prosecutors into more specific types. The single largest number of prosecutions of these matters through June 2018 was for "White Collar Crime", accounting for 63.6 percent of prosecutions.
The second largest number of matters were Prosecutions filed under the program area of "Withheld by Govt from TRAC " (22%) . The "Other" category in Figure 2 is comprised of a diverse group of programs. The largest specific programs within the "Other" category were: Government Regulatory" (5.7%), "Narcotics/Drugs" (4.4%).
[The Department of Justice is withholding the program area for 22% of the cases. These matters are also included in the "Other" category. TRAC, in ongoing litigation, has challenged the government's withholding of program category information, winning a substantial victory in September 2006 decision. The government, however, has filed a notice of appeal which has stayed the order requiring it to release program information.]
Top Ranked Lead Charges
Table 2 shows the top lead charges recorded in the prosecutions of matters filed in U.S. District Court during the first nine months of FY 2018.
Note: There were an additional 100 other lead charges which were not individually ranked. See latest monthly report if you want all lead charges included in rankings for the latest month, or use TRACFED criminal analyzer tool for complete listing for any year.
Lead Charge Count Rank 1 yr ago 5 yrs ago 10 yrs ago 20 yrs ago 26 USC 7206 - Fraud and False statements 128 1 1 1 2 2 More 26 USC 7201 - Attempt to evade or defeat tax 78 2 2 2 1 1 More 18 USC 371 - Conspiracy to commit offense or to defraud US 46 3 3 4 4 5 More 18 USC 1343 - Fraud by wire, radio, or television 39 4 3 11 11 14 More 18 USC 1956 - Laundering of monetary instruments 25 5 10 7 3 4 More 21 USC 846 - Attempt and conspiracy 19 6 17 12 10 3 More 18 USC 287 - False, fictitious or fraudulent claims 17 7 5 5 5 7 More 18 USC 641 - Public money, property or records 17 7 6 3 34 15 More 26 USC 7202 - Willful failure to collect or pay over tax 17 7 11 13 13 29 More 18 USC 286 - Conspiracy to defraud the Government claims 16 10 7 6 8 8 More
Table 2: Top charges filed
"Fraud and False statements" (Title 26 U.S.C Section 7206) was the most frequent recorded lead charge. Title 26 U.S.C Section 7206 was ranked 1st a year ago, while it was the 1st most frequently invoked five years ago. It was ranked 2nd ten years ago and 2nd twenty years ago.
Ranked 2nd in frequency was the lead charge "Attempt to evade or defeat tax" under Title 26 U.S.C Section 7201. Title 26 U.S.C Section 7201 was ranked 2nd a year ago, while it was the 2nd most frequently invoked five years ago. It was ranked 1st ten years ago and 1st twenty years ago.
Ranked 3rd was "Conspiracy to commit offense or to defraud US" under Title 18 U.S.C Section 371. Title 18 U.S.C Section 371 was ranked 3rd a year ago, while it was the 4th most frequently invoked five years ago. It was ranked 4th ten years ago and 5th twenty years ago.
Again among the top ten lead charges, the one showing the sharpest projected decline in prosecutions compared to one year ago—down -61 percent—was "False, fictitious or fraudulent claims " (Title 18 U.S.C Section 287 ). This was the same statute that had the largest projected decrease—-85%—when compared with five years ago.
Top Ranked Judicial Districts
During FY 2017 the Justice Department said the government obtained 3.5 prosecutions for every one million people in the United States. If pace during the first nine months of FY 2018 continues at the same rate, prosecutions for one million people in the United States this year will be 2.7 . Understandably, there is great variation in the per capita number of prosecutions in each of the nation's ninety-four federal judicial districts
Judicial District Percapita Count Rank 1yr ago 5yrs ago 10yrs ago 20yrs ago Alaska 15 8 1 5 1 2 2 More Penn, W 6 18 2 11 36 19 41 More Ohio, S 6 28 3 25 19 20 3 More Ga, M 6 9 4 6 27 10 86 More Ala, M 6 5 5 62 2 30 35 More W Virg, N 6 4 6 1 62 31 19 More N. Y., W 6 12 7 19 12 3 33 More Wisc, W 6 10 8 52 82 81 82 More La, E 6 7 9 42 75 52 46 More Idaho 6 7 10 19 67 50 81 More
Table 3: Top 10 districts (per one million people)
The District of Alaska—with 14.82 prosecutions as compared with 2.7 prosecutions per one million people in the United States—was the most active through June 2018. The District of Alaska was ranked 5th a year ago, while it was ranked 1st five years ago. The district's position ten years ago was 2nd as well as twenty years ago.
The Western District of Pennsylvania (Pittsburgh) ranked 2nd.
The Southern District of Ohio (Cincinnati) now ranks 3rd.
Recent entries to the top 10 list were Western District of Pennsylvania (Pittsburgh), Western District of New York (Buffalo), Idaho, Southern District of Ohio (Cincinnati), Eastern District of Louisiana (New Orleans), Western District of Wisconsin (Madison) and Middle District of Alabama (Montgomery), now ranked 2nd, 7th, 10th, 3rd, 9th, 8th and 5th. These districts ranked 11th, 19th, 19th, 25th, 42nd, 52nd and 62nd one year ago and 36th, 12th, 67th, 19th, 75th, 82nd and 2nd five years ago.
Compared to 10 years ago, Western District of Pennsylvania (Pittsburgh), Southern District of Ohio (Cincinnati), Middle District of Alabama (Montgomery), Northern District of West Virginia (Wheeling), Idaho, Eastern District of Louisiana (New Orleans) and Western District of Wisconsin (Madison) now ranked in the top 10 did not appear in the top ten.
And compared to 20 years ago, Northern District of West Virginia (Wheeling), Western District of New York (Buffalo), Middle District of Alabama (Montgomery), Western District of Pennsylvania (Pittsburgh), Eastern District of Louisiana (New Orleans), Idaho, Western District of Wisconsin (Madison) and Middle District of Georgia (Macon) were not sufficiently active to then make the top 10.
The federal judicial district which showed the greatest projected growth in the rate of prosecutions compared to one year ago—122 percent—was Middle District of Alabama (Montgomery). Compared to five years ago, the district with the largest projected growth—230 percent—was Western District of Wisconsin (Madison) .
In the last year, the judicial District Court recording the largest projected drop in the rate of prosecutions—64.4 percent—was Northern District of West Virginia (Wheeling).
Report Generated: August 6, 2018