Official Corruption Prosecutions for May 2018
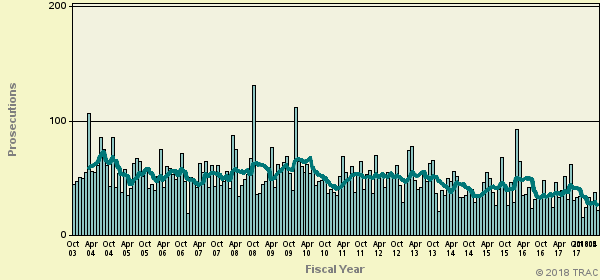
The latest available data from the Justice Department show that during May 2018 the government reported 22 new official corruption prosecutions. According to the case-by-case information analyzed by the Transactional Records Access Clearinghouse (TRAC), this number is down from 38 the previous month.
The comparisons of the number of defendants charged with official corruption-related offenses are based on case-by-case information obtained by TRAC under the Freedom of Information Act from the Executive Office for United States Attorneys (see Table 2).
When monthly 2018 prosecutions of this type are compared with those of the same period in the previous year, the number of filings was down (-23.7%). Prosecutions over the past year are still much lower than they were five years ago. Overall, the data show that prosecutions of this type are down 48.1 percent from levels reported in 2013.
The decrease from the levels five years ago in official corruption prosecutions for these matters is shown more clearly in Figure 2. The vertical bars in Figure 2 represent the number of official corruption prosecutions of this type recorded on a month-to-month basis. Where a prosecution was initially filed in U.S. Magistrate Court and then transferred to the U.S. District Court, the magistrate filing date was used since this provides an earlier indicator of actual trends. The superimposed line on the bars plots the six-month moving average so that natural fluctuations are smoothed out. To view trends year-by-year rather than month-by-month, see TRAC's annual report series for a broader picture.
Number of Defendants in Official Corruption Cases
Table 2 lists all separate cases with the number of defendants.
Case Defendant # 2018 - Puer Rico (Hayto Ray) Case: 1 1 Details 2018 - Puer Rico (Hayto Ray) Case: 1 2 Details 2018 - Puer Rico (Hayto Ray) Case: 1 3 Details 2018 - Puer Rico (Hayto Ray) Case: 1 4 Details 2018 - Arizona (Phoenix) Case: 2 1 Details 2018 - Arizona (Phoenix) Case: 2 2 Details 2018 - Mich, E (Detroit) Case: 3 1 Details 2018 - Mich, E (Detroit) Case: 3 2 Details 2018 - Cal, E (Sacramento) Case: 4 1 Details 2018 - Fla, M (Tampa) Case: 5 1 Details 2018 - Ga, N (Atlanta) Case: 6 1 Details 2018 - Ken, E (Lexington) Case: 7 1 Details 2018 - Mo, W (Kansas City) Case: 8 1 Details 2018 - N. J. (Newark) Case: 9 1 Details 2018 - N. J. (Newark) Case: 10 1 Details 2018 - N Mexico (Albuquerque) Case: 11 1 Details 2018 - N. Y., S (Manhattan) Case: 12 1 Details 2018 - Oregon (Portland) Case: 13 1 Details 2018 - Tenn, M (Nashville) Case: 14 1 Details 2018 - Virg, E (Alexandria) Case: 15 1 Details 2018 - Virg, W (Roanoke) Case: 16 1 Details 2018 - Wisc, W (Madison) Case: 17 1 Details Table 2. Number of Defendants per Case
Report Generated: August 6, 2018

