California South Immigration Prosecutions for July 2018
Lead Charge: 08 USC 1324 - Bringing in and harboring certain aliens
U.S. District Court
The latest available data from the Justice Department show that during July 2018 the government reported 16 new immigration prosecutions in the Southern District of California (San Diego) for these matters. Those cases in the U.S. District Court had a lead charge of 08 USC 1324 - Bringing in and harboring certain aliens. According to the case-by-case information analyzed by the Transactional Records Access Clearinghouse (TRAC), this number is down from 71 the previous month.
The comparisons of the number of defendants charged with immigration-related offenses are based on case-by-case information obtained by TRAC under the Freedom of Information Act from the Executive Office for United States Attorneys (see Table 2).
When monthly 2018 prosecutions of this type are compared with those of the same period in the previous year, the number of filings was down (-20.1%). Prosecutions over the past year are still much higher than they were five years ago. Overall, the data show that prosecutions of this type are up 36.7 percent from levels reported in 2013.
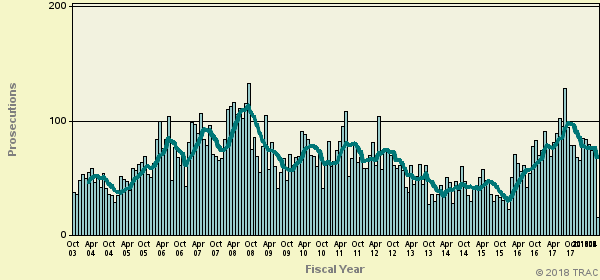
The increase from the levels five years ago in immigration prosecutions for these matters is shown more clearly in Figure 2. The vertical bars in Figure 2 represent the number of immigration prosecutions of this type recorded on a month-to-month basis. Where a prosecution was initially filed in U.S. Magistrate Court and then transferred to the U.S. District Court, the magistrate filing date was used since this provides an earlier indicator of actual trends. The superimposed line on the bars plots the six-month moving average so that natural fluctuations are smoothed out. To view trends year-by-year rather than month-by-month, see TRAC's annual report series for a broader picture.
Number of Defendants in Immigration Cases
Table 2 lists all separate cases with the number of defendants.
Case Defendant # 2018 - Cal, S (San Diego) Case: 1 1 Details 2018 - Cal, S (San Diego) Case: 1 2 Details 2018 - Cal, S (San Diego) Case: 1 3 Details 2018 - Cal, S (San Diego) Case: 1 4 Details 2018 - Cal, S (San Diego) Case: 2 1 Details 2018 - Cal, S (San Diego) Case: 2 2 Details 2018 - Cal, S (San Diego) Case: 3 1 Details 2018 - Cal, S (San Diego) Case: 3 2 Details 2018 - Cal, S (San Diego) Case: 4 1 Details 2018 - Cal, S (San Diego) Case: 5 1 Details 2018 - Cal, S (San Diego) Case: 6 1 Details 2018 - Cal, S (San Diego) Case: 7 1 Details 2018 - Cal, S (San Diego) Case: 8 1 Details 2018 - Cal, S (San Diego) Case: 9 1 Details 2018 - Cal, S (San Diego) Case: 10 1 Details 2018 - Cal, S (San Diego) Case: 11 1 Details Table 2. Number of Defendants per Case
Report Generated: August 29, 2018