Convictions for 2018
Lead Charge: 08 USC 1325 - Entry of alien at improper time or place; etc.
Number Year-to-date 37,025 Percent Change from previous year 87.3 Percent Change from 5 years ago -6.6 Percent Change from 10 years ago 10 Percent Change from 20 years ago 1818
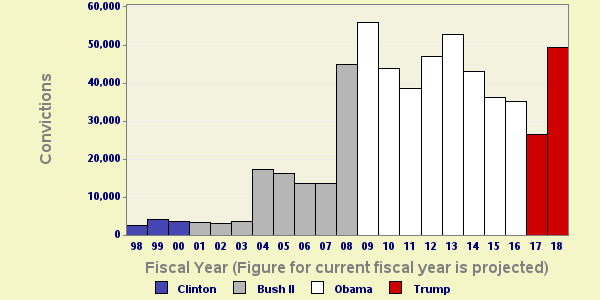
Table 1: Criminal ConvictionsThe latest available data from the Justice Department show that during the first nine months of FY 2018 the government reported 37,025 new convictions for these matters. Those cases had a lead charge of "08 USC 1325 - Entry of alien at improper time or place; etc.". If this activity continues at the same pace, the annual total of convictions will be 49,367 for this fiscal year. According to the case-by-case information analyzed by the Transactional Records Access Clearinghouse (TRAC), this estimate is up 87.3% over the past fiscal year when the number of convictions totaled 26,364.
The comparisons of the number of defendants convicted for offenses are based on case-by-case information obtained by TRAC under the Freedom of Information Act from the Executive Office for United States Attorneys (see Table 1).
Compared to five years ago when there were 52,829, the estimate of FY 2018 convictions of this type is down 6.6 percent. Convictions over the past year are still higher than they were ten years ago. Overall, the data show that convictions of this type are up 10 percent from the level of 44,888 reported in 2008 and up 1818 percent from the level of 2,574 reported in 1998.
The long term trend in convictions for these matters going back to FY 1998 is shown more clearly in Figure 1. The vertical bars in Figure 1 represent the number of convictions of this type recorded each fiscal year. Projected figures for the current fiscal year are shown. Each presidential administration is distinguished by the color of the bars. To view trends month-by-month rather than year-by-year, see TRAC's monthly report series for the latest data.
Leading Program Areas
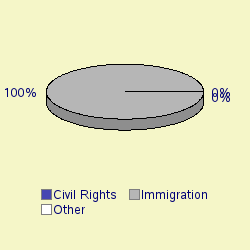
Cases were classified by prosecutors into more specific types. The single largest number of convictions of these matters through June 2018 was for "Immigration", accounting for 99.8 percent of convictions.
The second largest number of matters were Convictions filed under the program area of "Civil Rights " (0.1%) .
Leading Investigative Agencies
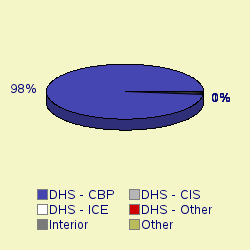
The lead investigative agency for convictions through June 2018 was "Homeland Security - Customs and Border Protection" accounting for 98.4 percent of convictions.
As shown in Figure 3, additional agencies with substantial numbers of convictions were: Homeland Security - Immigration and Customs Enforcement (1.1%).
Top Ranked Judicial Districts
During FY 2017 the Justice Department said the government obtained 81.6 convictions for every one million people in the United States. If pace during the first nine months of FY 2018 continues at the same rate, convictions for one million people in the United States this year will be 152.8 . Understandably, there is great variation in the per capita number of convictions in each of the nation's ninety-four federal judicial districts
Judicial District Percapita Count Rank 1yr ago 5yrs ago 10yrs ago 20yrs ago N Mexico 2,402 3,749 1 3 3 4 8 More Texas, W 2,156 11,469 2 1 2 1 2 More Texas, S 2,132 15,364 3 2 1 2 6 More Arizona 857 4,454 4 4 4 3 1 More Cal, S 699 1,834 5 5 5 5 3 More N. Y., N 32 81 6 6 6 11 5 More N Dakota 12 7 7 7 14 21 - More Maine 5 5 8 13 28 22 11 More Vermont 4 2 9 8 8 9 12 More Fla, S 3 19 10 10 35 48 31 More
Table 2: Top 10 districts (per one million people)
The District of New Mexico—with 2,402.03 convictions as compared with 152.8 convictions per one million people in the United States—was the most active through June 2018. The District of New Mexico was ranked 3rd a year ago as well as five years ago. The district's position ten years ago was 4th and 8th twenty years ago.
The Western District of Texas (San Antonio) ranked 2nd. The Western District of Texas (San Antonio) was ranked 1st a year ago, while it was ranked 2nd five years ago. The district's position ten years ago was 1st and 2nd twenty years ago.
The Southern District of Texas (Houston) now ranks 3rd. The Southern District of Texas (Houston) was ranked 2nd a year ago, while it was ranked 1st five years ago. The district's position ten years ago was 2nd and 6th twenty years ago.
A recent entry to the top 10 list was Maine, now ranked 8th. This district ranked 13th one year ago and 28th five years ago.
Compared to 10 years ago, Northern District of New York (Syracuse), North Dakota, Maine and Southern District of Florida (Miami) now ranked in the top 10 did not appear in the top ten.
And compared to 20 years ago, Maine, Vermont and Southern District of Florida (Miami) were not sufficiently active to then make the top 10.
The federal judicial district which showed the greatest projected growth in the rate of convictions compared to one year ago—568 percent—was Maine. Compared to five years ago, the district with the largest projected growth—1136 percent—was Southern District of California (San Diego) .
In the last year, the judicial District Court recording the largest projected drop in the rate of convictions—33.3 percent—was Vermont.
Report Generated: August 13, 2018