Immigration Prosecutions for December 2017
Lead Charge: 08 USC 1324 - Bringing in and harboring certain aliens
U.S. District Court
The latest available data from the Justice Department show that during December 2017 the government reported 81 new immigration prosecutions for these matters. Those cases in the U.S. District Court had a lead charge of 08 USC 1324 - Bringing in and harboring certain aliens. According to the case-by-case information analyzed by the Transactional Records Access Clearinghouse (TRAC), this number is down 64.9 percent over the previous month.
The comparisons of the number of defendants charged with immigration-related offenses are based on case-by-case information obtained by TRAC under the Freedom of Information Act from the Executive Office for United States Attorneys (see Table 1).
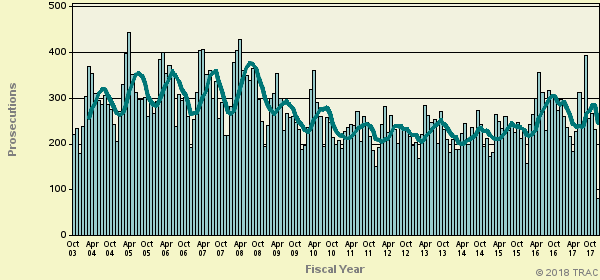
When monthly 2017 prosecutions of this type are compared with those of the same period in the previous year, the number of filings was down (-14.4%). Prosecutions over the past year are still much higher than they were five years ago. Overall, the data show that prosecutions of this type are up 11.9 percent from levels reported in 2012.
The increase from the levels five years ago in immigration prosecutions for these matters is shown more clearly in Figure 1. The vertical bars in Figure 1 represent the number of immigration prosecutions of this type recorded on a month-to-month basis. Where a prosecution was initially filed in U.S. Magistrate Court and then transferred to the U.S. District Court, the magistrate filing date was used since this provides an earlier indicator of actual trends. The superimposed line on the bars plots the six-month moving average so that natural fluctuations are smoothed out. The one and five-year rates of change in Table 1 and in the sections that follow are all based upon this six-month moving average. To view trends year-by-year rather than month-by-month, see TRAC's annual report series for a broader picture.
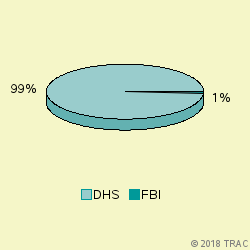
Virtually all federal criminal prosecutions for immigration offenses in December 2017 (99 percent) were referred by the Department of Homeland Security (DHS). The two lead investigative agencies in DHS are Customs and Border Protection (CBP) whose border patrol agencies guard the county's borders, and Immigration and Customs Enforcement (ICE), responsible for conducting most immigration criminal investigations under the immigration laws. See Figure 2.
Immigration Prosecutions in U.S. District Courts
In December 2017, 81 defendants in new cases for these matters were charged in the U.S. District Courts. In addition during December there were an additional 169 defendants whose cases moved from the magistrate courts to the U.S. district courts after an indictment or information was filed. The sections which follow cover both sets of cases and therefore cover all matters filed in district court during December.
Top Ranked Judicial Districts
Understandably, there is great variation in the number of immigration prosecutions that are filed in each of the nation's ninety-four federal judicial districts.
The districts registering the largest number of prosecutions of this type last month are shown in Table 2.
The Southern District of California (San Diego) — with 94 prosecutions — was the most active during December 2017. The Southern District of California (San Diego) was ranked 2 a year ago, while it was ranked 2 for most frequent use five years ago.
The Southern District of Texas (Houston) ranked 2nd. The Southern District of Texas (Houston) was ranked 1 a year ago, while it was ranked 1 for most frequent use five years ago.
Western District of Texas (San Antonio) is now ranking 3rd. The Western District of Texas (San Antonio) was ranked 3 a year ago, while it was ranked 4 for most frequent use five years ago.
A recent entry to the top 10 list was Southern District of Mississippi (Jackson), now ranked 7th . This district ranked 15th one year ago and 12th five years ago.
The federal judicial district which showed the greatest growth in immigration prosecutions compared to one year ago — 500 percent — was Southern District of Mississippi (Jackson). Compared to five years ago, the district with the largest growth — 157.5 percent — was Western District of Texas (San Antonio).
In the last year, the judicial District Court recording the largest drop in immigration prosecutions — 48.6 percent — was Southern District of Florida (Miami). This was the same district that had the largest increase — 42.9 percent — when compared with five years ago.
Top Ranked District Judges
At any one time, there are about 680 federal District Court judges working in the United States. The judges recorded with the largest number of new immigration crime cases of this type during December 2017 are shown in Table 3.
Judge Count Rank 1yr ago 5yrs ago Moses, Alia M. Texas, W 23 1 1 20 More Burns, Larry Alan Cal, S 14 2 15 8 More Crane, Randy Texas, S 13 3 6 2 More Bencivengo, Cathy Ann Cal, S 11 4 14 13 More Hinojosa, Ricardo H. Texas, S 11 4 5 1 More Sabraw, Dana Makoto Cal, S 10 6 25 33 More Bashant, Cynthia Ann Cal, S 10 6 25 - More Ramos, Nelva Gonzales Texas, S 10 6 2 3 More Curiel, Gonzalo Paul Cal, S 8 9 36 41 More Alvarez, Micaela Texas, S 8 9 7 13 More Garcia Marmolejo, Marina Texas, S 8 9 3 10 More Table 3. Top Ten Judges
All 11 of the "top ten" judges were in districts which were in the top ten with the largest number of immigration filings. (Because of ties, there were a total of 11 judges in the "top ten" rankings.)
Judge Alia M. Moses in the Western District of Texas (San Antonio) ranked 1st with 23 defendants in immigration cases. Judge Moses also appeared in the top ten rankings one year ago (ranked 1).
Judge Larry Alan Burns in the Southern District of California (San Diego) ranked 2nd with 14 defendants in immigration cases.
Judge Randy Crane in the Southern District of Texas (Houston) ranked 3rd with 13 defendants in immigration cases. Judge Crane appeared in the top ten rankings one year (ranked 6) and five years ago (rank 2).
Report Generated: March 21, 2018