Prosecutions for 2015
Lead Charge: 08 USC 1253 - Alien hindering his/her removal from the US
Number Year-to-date 9 Percent Change from previous year -60.7 Percent Change from 5 years ago -54.2 Percent Change from 10 years ago -21.4 Count 20 years ago 0
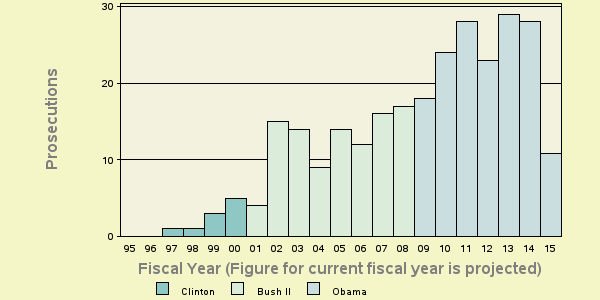
Table 1: Criminal ProsecutionsThe latest available data from the Justice Department show that during the first ten months of FY 2015 the government reported 9 new prosecutions for these matters. Those cases had a lead charge of "08 USC 1253 - Alien hindering his/her removal from the US". If this activity continues at the same pace, the annual total of prosecutions will be 11 for this fiscal year. According to the case-by-case information analyzed by the Transactional Records Access Clearinghouse (TRAC), this estimate is down 60.7% over the past fiscal year when the number of prosecutions totaled 28.
The comparisons of the number of defendants charged with offenses are based on case-by-case information obtained by TRAC under the Freedom of Information Act from the Executive Office for United States Attorneys (see Table 1).
Compared to five years ago when there were 24, the estimate of FY 2015 prosecutions of this type is down 54.2 percent. Prosecutions over the past year are lower than they were ten years ago. Overall, the data show that prosecutions of this type are down 21.4 percent from the level of 14 reported in 2005.
The long term trend in prosecutions for these matters going back to FY 1995 is shown more clearly in Figure 1. The vertical bars in Figure 1 represent the number of prosecutions of this type recorded each fiscal year. Projected figures for the current fiscal year are shown. Each presidential administration is distinguished by the color of the bars. To view trends month-by-month rather than year-by-year, see TRAC's monthly report series for the latest data.
Leading Program Areas
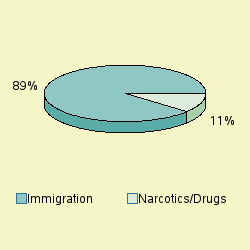
Cases were classified by prosecutors into more specific types. The single largest number of prosecutions of these matters through July 2015 was for "Immigration", accounting for 88.9 percent of prosecutions.
The second largest number of matters were Prosecutions filed under the program area of "Narcotics/Drugs " (11.1%) .
Leading Investigative Agencies
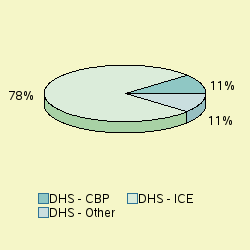
The lead investigative agency for prosecutions through July 2015 was "Homeland Security - Immigration and Customs Enforcement" accounting for 77.8 percent of prosecutions referred.
As shown in Figure 3, additional agencies with substantial numbers of referrals were: Homeland Security - Customs and Border Protection (11.1%), "Homeland Security - Other" (11.1%).
Number of Defendants in Cases
Table 2 lists all separate cases with the number of defendants.
Case Defendant # 2015 - Fla_S (Fla_S) Case: 1 1 Details 2015 - Guam (Agana) Case: 2 1 Details 2015 - Kansas (Topeka) Case: 3 1 Details 2015 - Ken_E (Ken_E) Case: 4 1 Details 2015 - Ken_E (Ken_E) Case: 5 1 Details 2015 - Nevada (Las Vegas) Case: 6 1 Details 2015 - Penn_M (Penn_M) Case: 7 1 Details 2015 - Texas_N (Texas_N) Case: 8 1 Details 2015 - Texas_S (Texas_S) Case: 9 1 Details
Table 2: Number of defendants per case
Greater detail for the activity up to last month (July 2015) can be viewed in TRAC's monthly report series. For earlier periods going back through FY 1986, full details can be accessed using the Criminal analyzer list tool in TRACFED on any data slice stored in your weblocker.
Report Generated: September 27, 2015