Immigration Prosecutions for 2014
Number Year-to-date 86,574 Percent Change from previous year -11.1 Percent Change from 5 years ago -5.8 Percent Change from 10 years ago 129 Percent Change from 20 years ago 1406
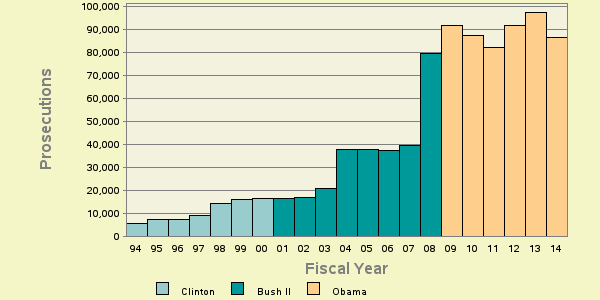
Table 1: Criminal Immigration ProsecutionsThe latest available data from the Justice Department show that during FY 2014 the government reported 86,574 new immigration prosecutions. According to the case-by-case information analyzed by the Transactional Records Access Clearinghouse (TRAC), this number is down 11.1% over the past fiscal year when the number of prosecutions totaled 97,384.
The comparisons of the number of defendants charged with immigration-related offenses are based on case-by-case information obtained by TRAC under the Freedom of Information Act from the Executive Office for United States Attorneys (see Table 1).
Compared to five years ago when there were 91,899, the number of FY 2014 prosecutions of this type is down 5.8 percent. Prosecutions over the past year are still much higher than they were ten years ago. Overall, the data show that prosecutions of this type are up 129 percent from the level of 37,884 reported in 2004 and up 1406 percent from the level of 5,747 reported in 1994.
The long term trend in immigration prosecutions for these matters going back to FY 1994 is shown more clearly in Figure 1. The vertical bars in Figure 1 represent the number of immigration prosecutions of this type recorded each fiscal year. Each presidential administration is distinguished by the color of the bars. To view trends month-by-month rather than year-by-year, see TRAC's monthly report series for the latest data.
Leading Program Categories
Within the broad category of immigration, cases were classified by prosecutors into more specific types.
The single largest number of prosecutions of these matters through September 2014 was for "Immigration", accounting for all prosecutions.
Leading Investigative Agencies
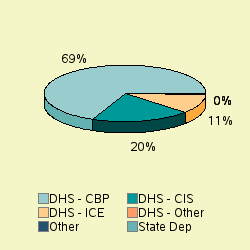
The lead investigative agency for immigration prosecutions through September 2014 was "Homeland Security - Customs and Border Protection" accounting for 68.5 percent of prosecutions referred.
As shown in Figure 2, additional agencies with substantial numbers of immigration referrals were: Homeland Security - Citizen and Immigration Services (19.9%), "Homeland Security - Immigration and Customs Enforcement" (10.7%).
Top Ranked Lead Charges
Table 2 shows the top lead charges recorded in the prosecutions of immigration matters filed in U.S. District Court during FY 2014.
Note: There were an additional 97 other lead charges which were not individually ranked. See latest monthly report if you want all lead charges included in rankings for the latest month, or use TRACFED criminal analyzer tool for complete listing for any year.
Lead Charge Count Rank 1 yr ago 5 yrs ago 10 yrs ago 20 yrs ago 08 USC 1325 - Entry of alien at improper time or place; etc. 43,089 1 1 1 1 4 More 08 USC 1326 - Reentry of deported alien 37,812 2 2 2 2 1 More 08 USC 1324 - Bringing in and harboring certain aliens 3,413 3 3 3 3 2 More 18 USC 1546 - Fraud and misuse of visas, permits, and other documents 852 4 4 4 4 3 More 18 USC 1544 - Misuse of passport 473 5 5 10 13 15 More 18 USC 1028 - Fraud and related activity - id documents 271 6 6 5 8 9 More 18 USC 1542 - False statement in application and use of passport 105 7 8 8 7 7 More 18 USC 1001 - Fraud/false statements or entries generally 56 8 10 7 5 8 More 18 USC 911 - False personification - Citizen of the US 51 9 7 6 6 5 More 18 USC 3144 - Release or detention of a material witness 45 10 22 13 26 15 More
Table 2: Top charges filed
"Entry of alien at improper time or place; etc." (Title 8 U.S.C Section 1325) was the most frequent recorded lead charge. Title 8 U.S.C Section 1325 was ranked 1st a year ago, while it was the 1st most frequently invoked five years ago. It was ranked 1st ten years ago and 4th twenty years ago.
Ranked 2nd in frequency was the lead charge "Reentry of deported alien" under Title 8 U.S.C Section 1326. Title 8 U.S.C Section 1326 was ranked 2nd a year ago, while it was the 2nd most frequently invoked five years ago. It was ranked 2nd ten years ago and 1st twenty years ago.
Ranked 3rd was "Bringing in and harboring certain aliens" under Title 8 U.S.C Section 1324. Title 8 U.S.C Section 1324 was ranked 3rd a year ago, while it was the 3rd most frequently invoked five years ago. It was ranked 3rd ten years ago and 2nd twenty years ago.
Among these top ten lead charges, the one showing the greatest increase in prosecutions—up 275 percent—compared to one year ago was Title 18 U.S.C Section 3144 that involves "Release or detention of a material witness ". This was the same statute that had the largest increase—291%—when compared with five years ago.
Again among the top ten lead charges, the one showing the sharpest decline in prosecutions compared to one year ago—down 66.7 percent—was "False personification - Citizen of the US " (Title 18 U.S.C Section 911 ). This was the same statute that had the largest decrease—82.1%—when compared with five years ago.
Top Ranked Judicial Districts
Understandably, there is great variation in the number of immigration prosecutions in each of the nation's ninety-four federal judicial districts. The districts registering the largest number of prosecutions of this type during the first twelve months of FY 2014 are shown in Table 3.
Judicial District Count Rank 1yr ago 5yrs ago 10yrs ago 20yrs ago Texas, S 29,725 1 1 1 1 3 More Arizona 25,110 2 3 2 3 2 More Texas, W 18,574 3 2 3 2 4 More N Mexico 3,753 4 4 4 5 10 More Cal, S 3,374 5 5 5 4 1 More Fla, S 601 6 6 7 7 11 More Texas, N 271 7 8 13 8 9 More Fla, M 242 8 9 10 10 42 More Utah 228 9 12 15 11 49 More Cal, C 224 10 7 6 6 6 More
Table 3: Top 10 districts
The Southern District of Texas (Houston)—with 29,725 prosecutions—was the most active through September 2014. The Southern District of Texas (Houston) was ranked 1st a year ago as well as five years ago. The district's position ten years ago was 1st and 3rd twenty years ago.
The District of Arizona ranked 2nd. The District of Arizona was ranked 3rd a year ago, while it was ranked 2nd five years ago. The district's position ten years ago was 3rd and 2nd twenty years ago.
The Western District of Texas (San Antonio) now ranks 3rd. The Western District of Texas (San Antonio) was ranked 2nd a year ago, while it was ranked 3rd five years ago. The district's position ten years ago was 2nd and 4th twenty years ago.
A recent entry to the top 10 list was Utah, now ranked 9th. This district ranked 12th one year ago and 15th five years ago.
Compared to 10 years ago, Utah now ranked in the top 10 did not appear in the top ten.
And compared to 20 years ago, Southern District of Florida (Miami), Middle District of Florida (Tampa) and Utah were not sufficiently active to then make the top 10.
The federal judicial district which showed the greatest growth in immigration prosecutions compared to one year ago—9.28 percent—was Arizona. This was the same district that had the largest increase—12.0%—when compared with five years ago.
In the last year, the judicial District Court recording the largest drop in immigration prosecutions—50.0 percent—was Central District of California (Los Angeles).
Report Generated: November 19, 2014