Washington East Immigration Prosecutions for 2018
Number Year-to-date 87 Percent Change from previous year 15.9 Percent Change from 5 years ago -15.9 Percent Change from 10 years ago -37.5 Percent Change from 20 years ago -28
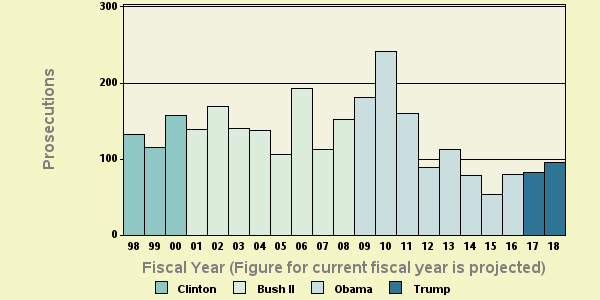
Table 1: Criminal Immigration ProsecutionsThe latest available data from the Justice Department show that during the first eleven months of FY 2018 the government reported 87 new immigration prosecutions in the Eastern District of Washington (Spokane). If this activity continues at the same pace, the annual total of prosecutions will be 95 for this fiscal year. According to the case-by-case information analyzed by the Transactional Records Access Clearinghouse (TRAC), this estimate is up 15.9% over the past fiscal year when the number of prosecutions totaled 82.
The comparisons of the number of defendants charged with immigration-related offenses are based on case-by-case information obtained by TRAC under the Freedom of Information Act from the Executive Office for United States Attorneys (see Table 1).
Compared to five years ago when there were 113, the estimate of FY 2018 prosecutions of this type is down 15.9 percent. Prosecutions over the past year are lower than they were ten years ago. Overall, the data show that prosecutions of this type are down 37.5 percent from the level of 152 reported in 2008 and down 28 percent from the level of 132 reported in 1998.
The long term trend in immigration prosecutions for these matters going back to FY 1998 is shown more clearly in Figure 1. The vertical bars in Figure 1 represent the number of immigration prosecutions of this type recorded each fiscal year. Projected figures for the current fiscal year are shown. Each presidential administration is distinguished by the color of the bars. To view trends month-by-month rather than year-by-year, see TRAC's monthly report series for the latest data.
Leading Investigative Agencies
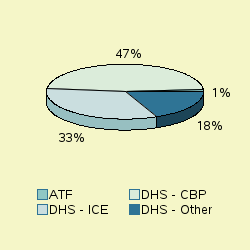
The lead investigative agency for immigration prosecutions through August 2018 was "Homeland Security - Customs and Border Protection" accounting for 47.1 percent of prosecutions referred.
As shown in Figure 2, additional agencies with substantial numbers of immigration referrals were: Homeland Security - Immigration and Customs Enforcement (33.3%), "Homeland Security - Other" (18.4%).
Top Ranked Lead Charges
Table 2 shows the top lead charges recorded in the prosecutions of immigration matters filed in U.S. District Court during the first eleven months of FY 2018.
Lead Charge Count Rank 1 yr ago 5 yrs ago 10 yrs ago 20 yrs ago 08 USC 1326 - Reentry of deported alien 83 1 1 1 1 1 More 08 USC 1324 - Bringing in and harboring certain aliens 2 2 2 6 3 2 More 18 USC 111 - Assaulting, resisting, impeding certain officers 1 3 - - - - More 18 USC 922 - Firearms; Unlawful acts 1 3 3 - 4 - More 18 USC 1542 - False statement in application and use of passport 0 5 - 6 9 4 More
Table 2: Top charges filed
"Reentry of deported alien" (Title 8 U.S.C Section 1326) was the most frequent recorded lead charge. Title 8 U.S.C Section 1326 was ranked 1st a year ago, while it was the 1st most frequently invoked five years ago. It was ranked 1st ten years ago and 1st twenty years ago.
Ranked 2nd in frequency was the lead charge "Bringing in and harboring certain aliens" under Title 8 U.S.C Section 1324. Title 8 U.S.C Section 1324 was ranked 2nd a year ago, while it was the 6th most frequently invoked five years ago. It was ranked 3rd ten years ago and 2nd twenty years ago.
Ranked 3rd were "Assaulting, resisting, impeding certain officers" under Title 18 U.S.C Section 111 and "Firearms; Unlawful acts" under Title 18 U.S.C Section 922. Title 18 U.S.C Section 922 was ranked 3rd a year ago. It was ranked 4th ten years ago.
Again among the top ten lead charges, the one showing the sharpest projected decline in prosecutions compared to one year ago—down -64 percent—was "Bringing in and harboring certain aliens " (Title 8 U.S.C Section 1324 ). This was the same statute that had the largest projected decrease—.%—when compared with five years ago.
Report Generated: October 23, 2018