Prosecutions for 2016
Number Year-to-date 123,026 Percent Change from previous year -5 Percent Change from 5 years ago -17.7 Percent Change from 10 years ago 15 Percent Change from 20 years ago 90.1
Table 1: Criminal ProsecutionsThe latest available data from the Justice Department show that during the first eleven months of FY 2016 the government reported 123,026 new prosecutions. If this activity continues at the same pace, the annual total of prosecutions will be 134,210 for this fiscal year. According to the case-by-case information analyzed by the Transactional Records Access Clearinghouse (TRAC), this estimate is down 5% over the past fiscal year when the number of prosecutions totaled 141,220.
The comparisons of the number of defendants charged with offenses are based on case-by-case information obtained by TRAC under the Freedom of Information Act from the Executive Office for United States Attorneys (see Table 1).
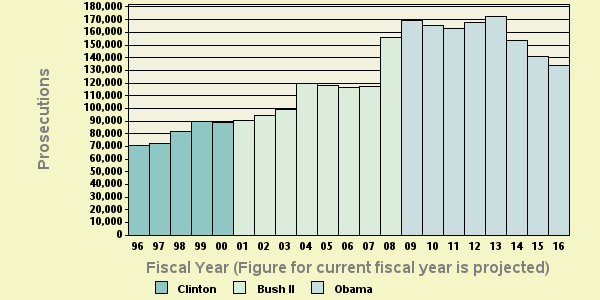
Compared to five years ago when there were 162,997, the estimate of FY 2016 prosecutions of this type is down 17.7 percent. Prosecutions over the past year are still higher than they were ten years ago. Overall, the data show that prosecutions of this type are up 15 percent from the level of 116,739 reported in 2006 and up 90.1 percent from the level of 70,587 reported in 1996.
The long term trend in prosecutions for these matters going back to FY 1996 is shown more clearly in Figure 1. The vertical bars in Figure 1 represent the number of prosecutions of this type recorded each fiscal year. Projected figures for the current fiscal year are shown. Each presidential administration is distinguished by the color of the bars. To view trends month-by-month rather than year-by-year, see TRAC's monthly report series for the latest data.
Leading Program Areas
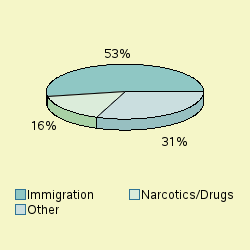
Cases were classified by prosecutors into more specific types. The single largest number of prosecutions of these matters through August 2016 was for "Immigration", accounting for 52.7 percent of prosecutions.
The second largest number of matters were Prosecutions filed under the program area of "Narcotics/Drugs " (16.4%) . The "Other" category in Figure 2 is comprised of a diverse group of programs. The largest specific programs within the "Other" category were: Weapons" (5.6%), "White Collar Crime" (4.6%).
[The Department of Justice is withholding the program area for 6.2% of the cases. These matters are also included in the "Other" category. TRAC, in ongoing litigation, has challenged the government's withholding of program category information, winning a substantial victory in September 2006 decision. The government, however, has filed a notice of appeal which has stayed the order requiring it to release program information.]
Leading Investigative Agencies
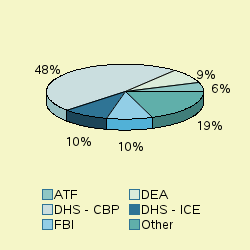
The lead investigative agency for prosecutions through August 2016 was "Homeland Security - Customs and Border Protection" accounting for 47.7 percent of prosecutions referred.
As shown in Figure 3, additional agencies with substantial numbers of referrals were: Homeland Security - Immigration and Customs Enforcement (9.5%), "Justice - Federal Bureau of Investigation" (9.5%), "Justice - Drug Enforcement Administration" (8.5%), "Justice - Alcohol, Tobacco, Firearms, and Explosives" (5.6%). The "Other" category in Figure 3 is comprised of a diverse group of agencies. The agencies with substantial numbers of within the "Other" category were: Interior" (2.6%), "Defense" (2.6%).
Top Ranked Lead Charges
Table 2 shows the top lead charges recorded in the prosecutions of matters filed in U.S. District Court during the first eleven months of FY 2016.
Note: There were an additional 494 other lead charges which were not individually ranked. See latest monthly report if you want all lead charges included in rankings for the latest month, or use TRACFED criminal analyzer tool for complete listing for any year.
Lead Charge Count Rank 1 yr ago 5 yrs ago 10 yrs ago 20 yrs ago 08 USC 1325 - Entry of alien at improper time or place; etc. 33,084 1 1 1 3 22 More 08 USC 1326 - Reentry of deported alien 26,964 2 2 2 1 3 More 21 USC 841 - Drug Abuse Prevention & Control-Prohibited acts A 9,991 3 3 3 2 1 More 21 USC 846 - Attempt and conspiracy 7,710 4 4 4 4 2 More 18 USC 922 - Firearms; Unlawful acts 6,165 5 5 5 5 4 More 08 USC 1324 - Bringing in and harboring certain aliens 3,494 6 6 6 6 11 More Federal Regulation 1,926 7 7 8 15 167 More Other US Code Section 1,247 8 8 18 39 21 More 21 USC 952 - Importation of controlled substances 1,236 9 11 9 8 10 More 18 USC 7 - Special Maritime/Territorial Jurisdiction of US 1,216 10 9 22 16 18 More
Table 2: Top charges filed
"Entry of alien at improper time or place; etc." (Title 8 U.S.C Section 1325) was the most frequent recorded lead charge. Title 8 U.S.C Section 1325 was ranked 1st a year ago, while it was the 1st most frequently invoked five years ago. It was ranked 3rd ten years ago and 22nd twenty years ago.
Ranked 2nd in frequency was the lead charge "Reentry of deported alien" under Title 8 U.S.C Section 1326. Title 8 U.S.C Section 1326 was ranked 2nd a year ago, while it was the 2nd most frequently invoked five years ago. It was ranked 1st ten years ago and 3rd twenty years ago.
Ranked 3rd was "Drug Abuse Prevention & Control-Prohibited acts A" under Title 21 U.S.C Section 841. Title 21 U.S.C Section 841 was ranked 3rd a year ago, while it was the 3rd most frequently invoked five years ago. It was ranked 2nd ten years ago and 1st twenty years ago.
Again among the top ten lead charges, the one showing the sharpest projected decline in prosecutions compared to one year ago—down -16 percent—was "Other US Code Section " (Title . U.S.C Section . ). This was the same statute that had the largest projected decrease—-37%—when compared with five years ago.
Top Ranked Judicial Districts
During FY 2015 the Justice Department said the government obtained 439.4 prosecutions for every one million people in the United States. If pace during the first eleven months of FY 2016 continues at the same rate, prosecutions for one million people in the United States this year will be 417.6 . Understandably, there is great variation in the per capita number of prosecutions in each of the nation's ninety-four federal judicial districts
Judicial District Percapita Count Rank 1yr ago 5yrs ago 10yrs ago 20yrs ago Texas, W 3,224 20,626 1 4 4 5 6 More N Mexico 2,968 5,673 2 5 3 4 10 More Texas, S 2,905 25,239 3 2 2 3 15 More Arizona 2,730 17,089 4 1 1 2 9 More Wyoming 2,207 1,186 5 3 5 1 14 More Cal, S 1,359 4,334 6 6 6 6 2 More S Dakota 700 542 7 9 10 9 5 More N Dakota 604 419 8 8 12 14 16 More Hawaii 579 760 9 7 7 10 3 More Virg, E 543 3,082 10 10 9 8 18 More
Table 3: Top 10 districts (per one million people)
The Western District of Texas (San Antonio)—with 3,224.18 prosecutions as compared with 417.6 prosecutions per one million people in the United States—was the most active through August 2016. The Western District of Texas (San Antonio) was ranked 4th a year ago as well as five years ago. The district's position ten years ago was 5th and 6th twenty years ago.
The District of New Mexico ranked 2nd. The District of New Mexico was ranked 5th a year ago, while it was ranked 3rd five years ago. The district's position ten years ago was 4th and 10th twenty years ago.
The Southern District of Texas (Houston) now ranks 3rd. The Southern District of Texas (Houston) was ranked 2nd a year ago as well as five years ago. The district's position ten years ago was 3rd and 15th twenty years ago.
Compared to 10 years ago, North Dakota now ranked in the top 10 did not appear in the top ten.
And compared to 20 years ago, Wyoming, Southern District of Texas (Houston), North Dakota and Eastern District of Virginia (Alexandria) were not sufficiently active to then make the top 10.
The federal judicial district which showed the greatest projected growth in the rate of prosecutions compared to one year ago—16.3 percent—was New Mexico. Compared to five years ago, the district with the largest projected growth—10.4 percent—was Western District of Texas (San Antonio) .
In the last year, the judicial District Court recording the largest projected drop in the rate of prosecutions—25.4 percent—was Wyoming.
Report Generated: October 27, 2016